

I. Introduction
Pulsed fusion spans two broad families, inertial and magneto-inertial, distinguished by whether magnetic fields contribute to confinement. The inertial branch leads on demonstrated physics: it remains the only fusion approach to have achieved target-level scientific breakeven, at NIF in 2022. Both routes must reach the same triple product, and the pulsed corridor bets that assembling dense fuel for nanoseconds is an easier engineering problem than holding dilute plasma for seconds.
In target-based inertial systems, the fusion event consumes a cheap target while much of the expensive driver hardware can sit well away from the worst heat and neutron flux. That creates two potential cost advantages: the driver may ultimately prove cheaper than a large magnetic confinement system per unit of plant output, while a power plant consuming tens to hundreds of millions of targets per year could drive costs down via a steep manufacturing learning curve. Magneto-inertial concepts pursue a similar high-density, short-confinement strategy, but their hardware and cost structures vary more substantially by design. This piece will survey the pulsed power landscape, anchor our 1costingFE model to external models, and map the likeliest corridors to low-cost pulsed fusion power.
The floor: 2.4 ¢/kWh
Neither pulsed configuration examined in this study reaches 1 ¢/kWh ($10/MWh) inside the evidence base. The floor was found to be 2.4 ¢/kWh (fiber laser direct drive configuration), and only at the speculation tier — sovereign capital, theoretical maximum driver efficiency, targets at a tenth of their costed price, and driver optics surviving three times their design-basis shot life.
What carries the descent: the cost of capital, the power conversion efficiency, and the availability, as expected. For high-yield/low frequency concepts, driver cost and wall-plug efficiency are key drivers, while target cost is particularly important in high frequency configurations.
The results below can be replicated from the analysis repository, which carries the ladder and sensitivity code together with the exact 1costingFE commit they were produced against. [13] We welcome correspondence on our modeling assumptions and methodology at 1cf.energy/contact.
II. The pulsed power landscape
The pulsed power landscape is varied, with some companies betting on cheap drivers winning the overall race to competitive LCOE, while others bet on driver longevity, cheap targets, or superior target gains. Of course, a combination of all these attributes would be ideal but they generally work against each other. All companies in the pulsed power field cite NIF as a physics basis, though in reality they are all extrapolating well beyond what NIF has proven, and some architectures bear very little resemblance to the famous LLNL demonstrator.
The figure below shows some key players in the pulsed power landscape, along with their estimated driver cost, consumable cost, chamber cost, and Q_eng. Where a company has published a figure we use it — Xcimer’s $60–80/J on target comes from their Feb 2026 commercialization whitepaper, MagLIF’s driver anchor from Pacific Fusion’s AMPS paper, arXiv:2504.10680. Where none exists, values are our own estimates built from component-level buildup and analogous hardware, and the consumable figures in particular carry the widest uncertainty. These are NOAK projections from companies with a commercial interest in appearing cheap, filtered through our own judgment about which claims are load-bearing. Treat the clustering as meaningful and the individual placements as indicative.
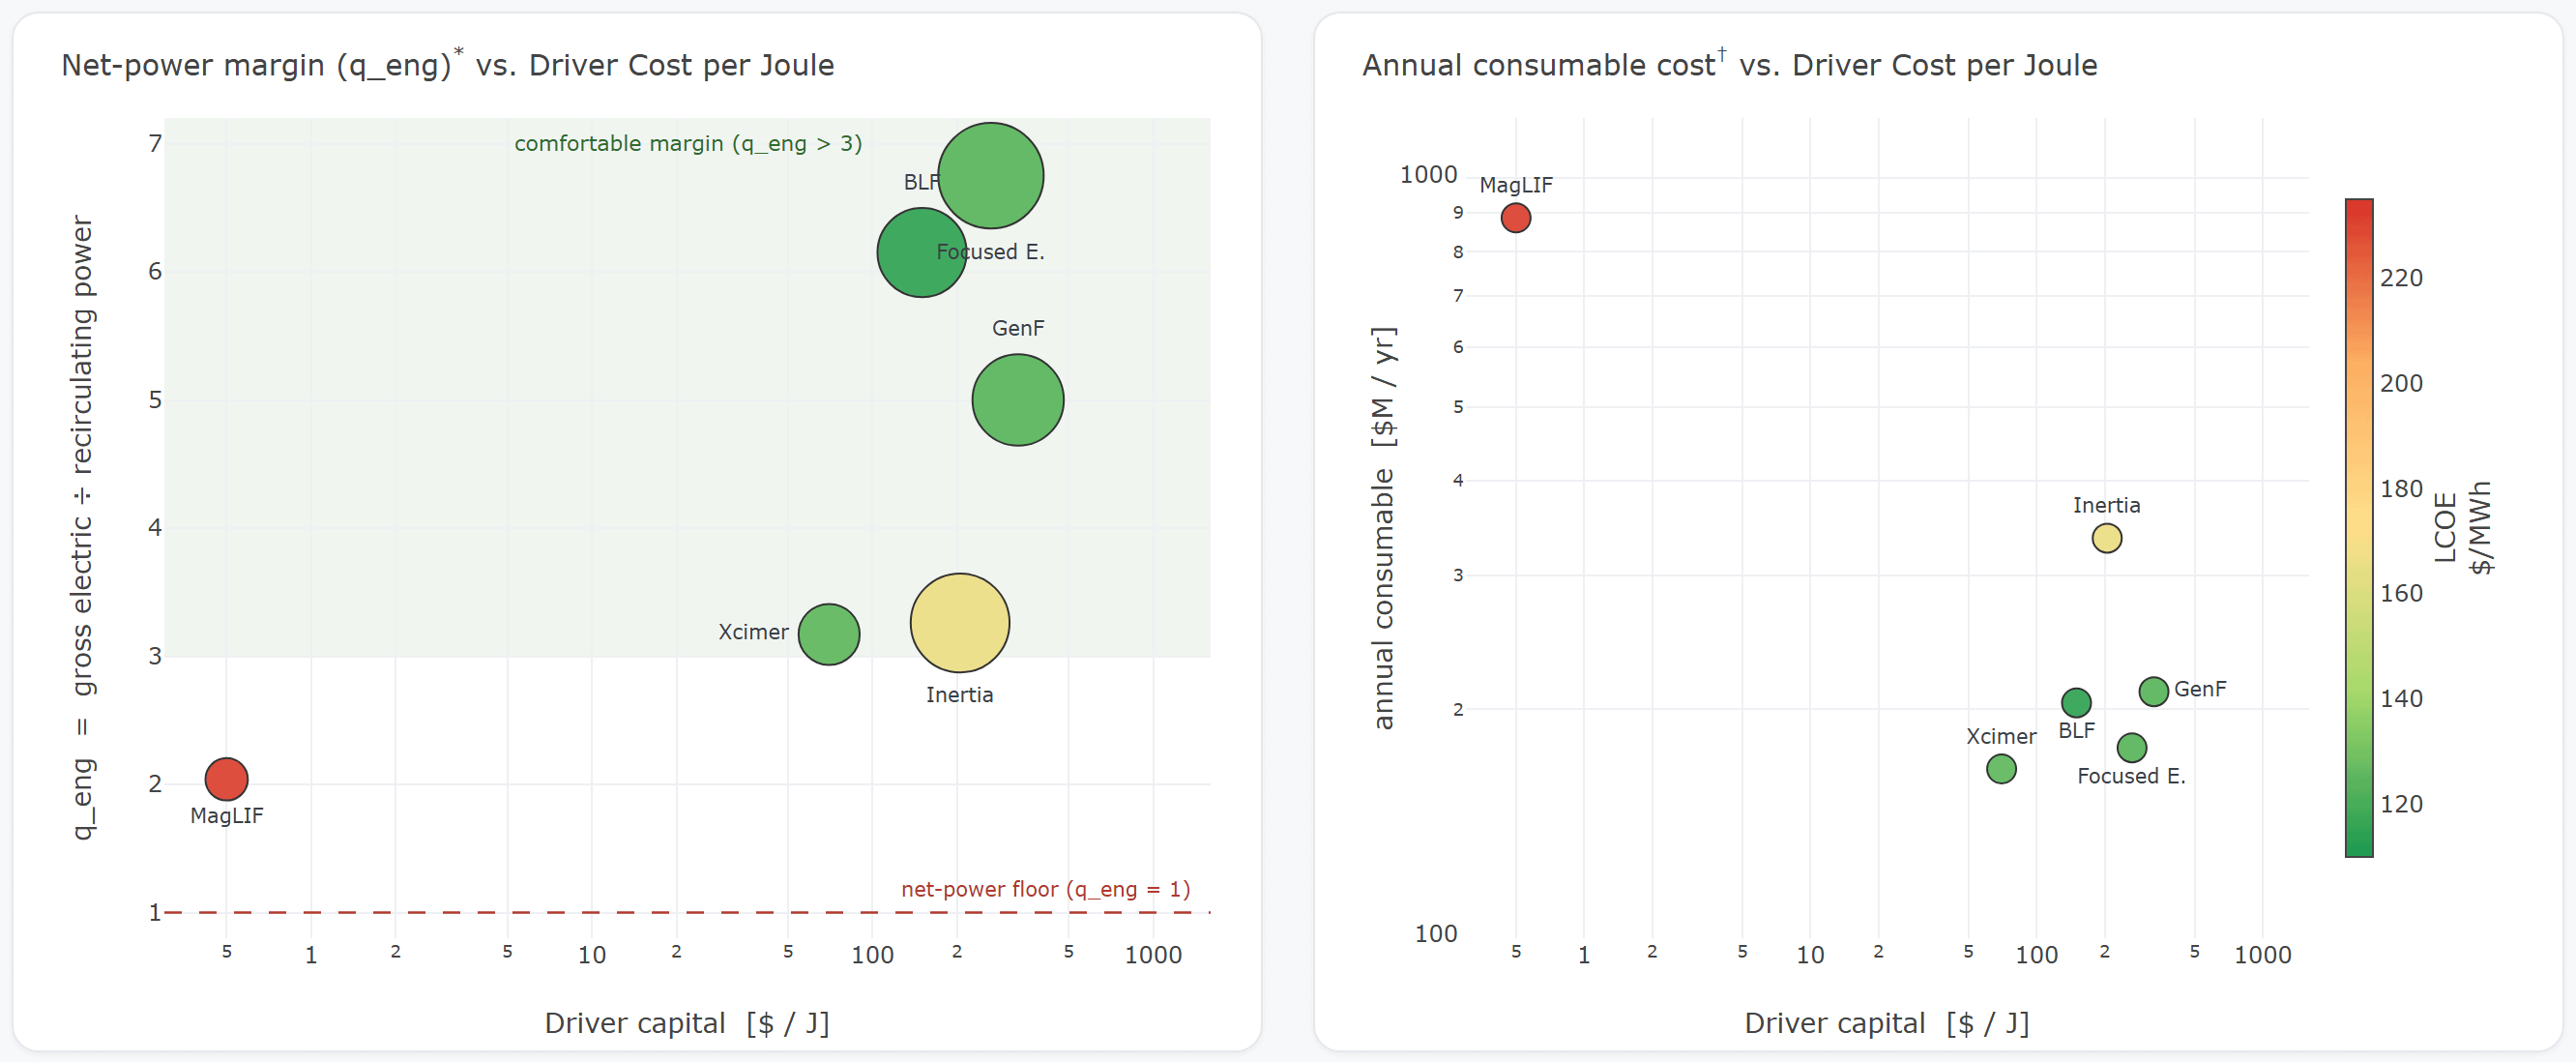
Figure 1. Pulsed-power landscape at 1 GWe scale. A shared driver-cost axis links each concept’s net-power margin to its annual consumable cost. Bubble area on the left panel is proportional to chamber + first-wall capital, spanning roughly $50M to $450M; marker color on both panels is LCOE.
How q_eng is derived
q_eng follows from each concept’s driver efficiency, target gain and conversion efficiency. The target gain is approximated by assuming each concept’s burn follows standard ICF physics for its drive mode and size, so gain is derived indirectly from the driver energy per shot:
gain = φ × (fuel loaded per driver joule) × coupling × eDT
where:
φ = ρR / (ρR + HB) and ρR ∝ E1/3
fuel loaded per driver joule = 1.1 mg/MJ
coupling = 1.0 for direct drive, < 0.5 for indirect configurations
eDT = specific fusion energy, ~3.4×10⁵ MJ/g for D‑T fuel
How the annualized consumable cost is computed
It is the levelized annual fuel-cycle cost — the fabricated target consumed each shot plus the raw isotope fuel. Unlike a per-shot figure it is rep-rate-normalized, so a low-rep concept firing few large targets can beat a high-rep one firing many cheap ones:
annual cost = ( target $/shot × shots/yr + isotope fuel $/yr ) × L
where:
shots/yr = frep × availability × 3.15×10⁷ s × nmod, availability = 0.85
target $/shot scales with assembled fuel mass (capsule / liner + RTL)
isotope fuel: D‑T breeds its own tritium (buys D + Li‑6, ≈ free)
L ≈ 1.36 = levelization (interest + inflation over plant life);
unburned, unrecovered isotope fuel is repurchased
NOTE: The following concepts have been excluded from this corridor due to coverage elsewhere or insufficient data coverage: pulsed FRC, heavy-ion ICF, dense plasma focus, wire-array Z-pinch, p-b11 ICF, acoustic ICF, magnetized target, sheared-flow Z-pinch, and piston-MIF.
Blue Laser Fusion posts the best Q_eng, on hybrid power conversion and higher-efficiency OEC fiber drivers. MagLIF is the outlier: a far cheaper driver paired with far more expensive consumables, a direct consequence of its liner and recyclable transmission line architecture. Xcimer carries the lowest combined driver, chamber, and target cost of any laser IFE concept — the driver because a gas laser needs fewer precision optics and only two beamlines, the chamber because a liquid lithium wall reduces the required chamber size and cuts replacement downtime. This analysis carries significant uncertainty and any of these approaches could end up leading the corridor through commercialization.
Regardless of the design approach, a successful pulsed architecture will balance four interconnected factors simultaneously:
Engineering gain sets plant size: at fixed net power output, higher Q_eng means a smaller gross plant with less recirculating power.
Lifetime driver costs scale nonlinearly with driver-energy-per-shot and linearly with cumulative cycle count.
Consumable target or liner cost must stay economical after multiplication by millions of shots per year.
Chamber cost scales with yield-per-shot based on whichever physics constraint binds: the per-shot fluence limit or the time-averaged neutron wall loading.
Assuming fixed net power, repetition rate (aka shot frequency) sets the required yield-per-shot and moves all four factors at once in opposing directions. Driver capital and chamber size fall as repetition rate rises; recirculating power and consumable cost rise with it. LCOE against repetition rate is therefore a convex optimization problem, with a unique solution for each concept’s distinct driver, chamber, and consumable cost curves. Finding this minimum LCOE is how we isolate the pulsed power concepts with the most commercial potential.
III. Anchoring the model
First, we surveyed publicly-available pulsed power models, measuring 1costingFE against Lawrence Livermore National Lab’s GEM tool and a tool derived from Nicholas Hawker’s A simplified economic model for inertial fusion, 2020. Rep rate is a key variable that moves all four technoeconomic axes at once, which makes it the natural sweep variable for comparing the three models. A DPSSL configuration is assumed for LLNL GEM and 1costingFE, while the Hawker model uses a generalized format.
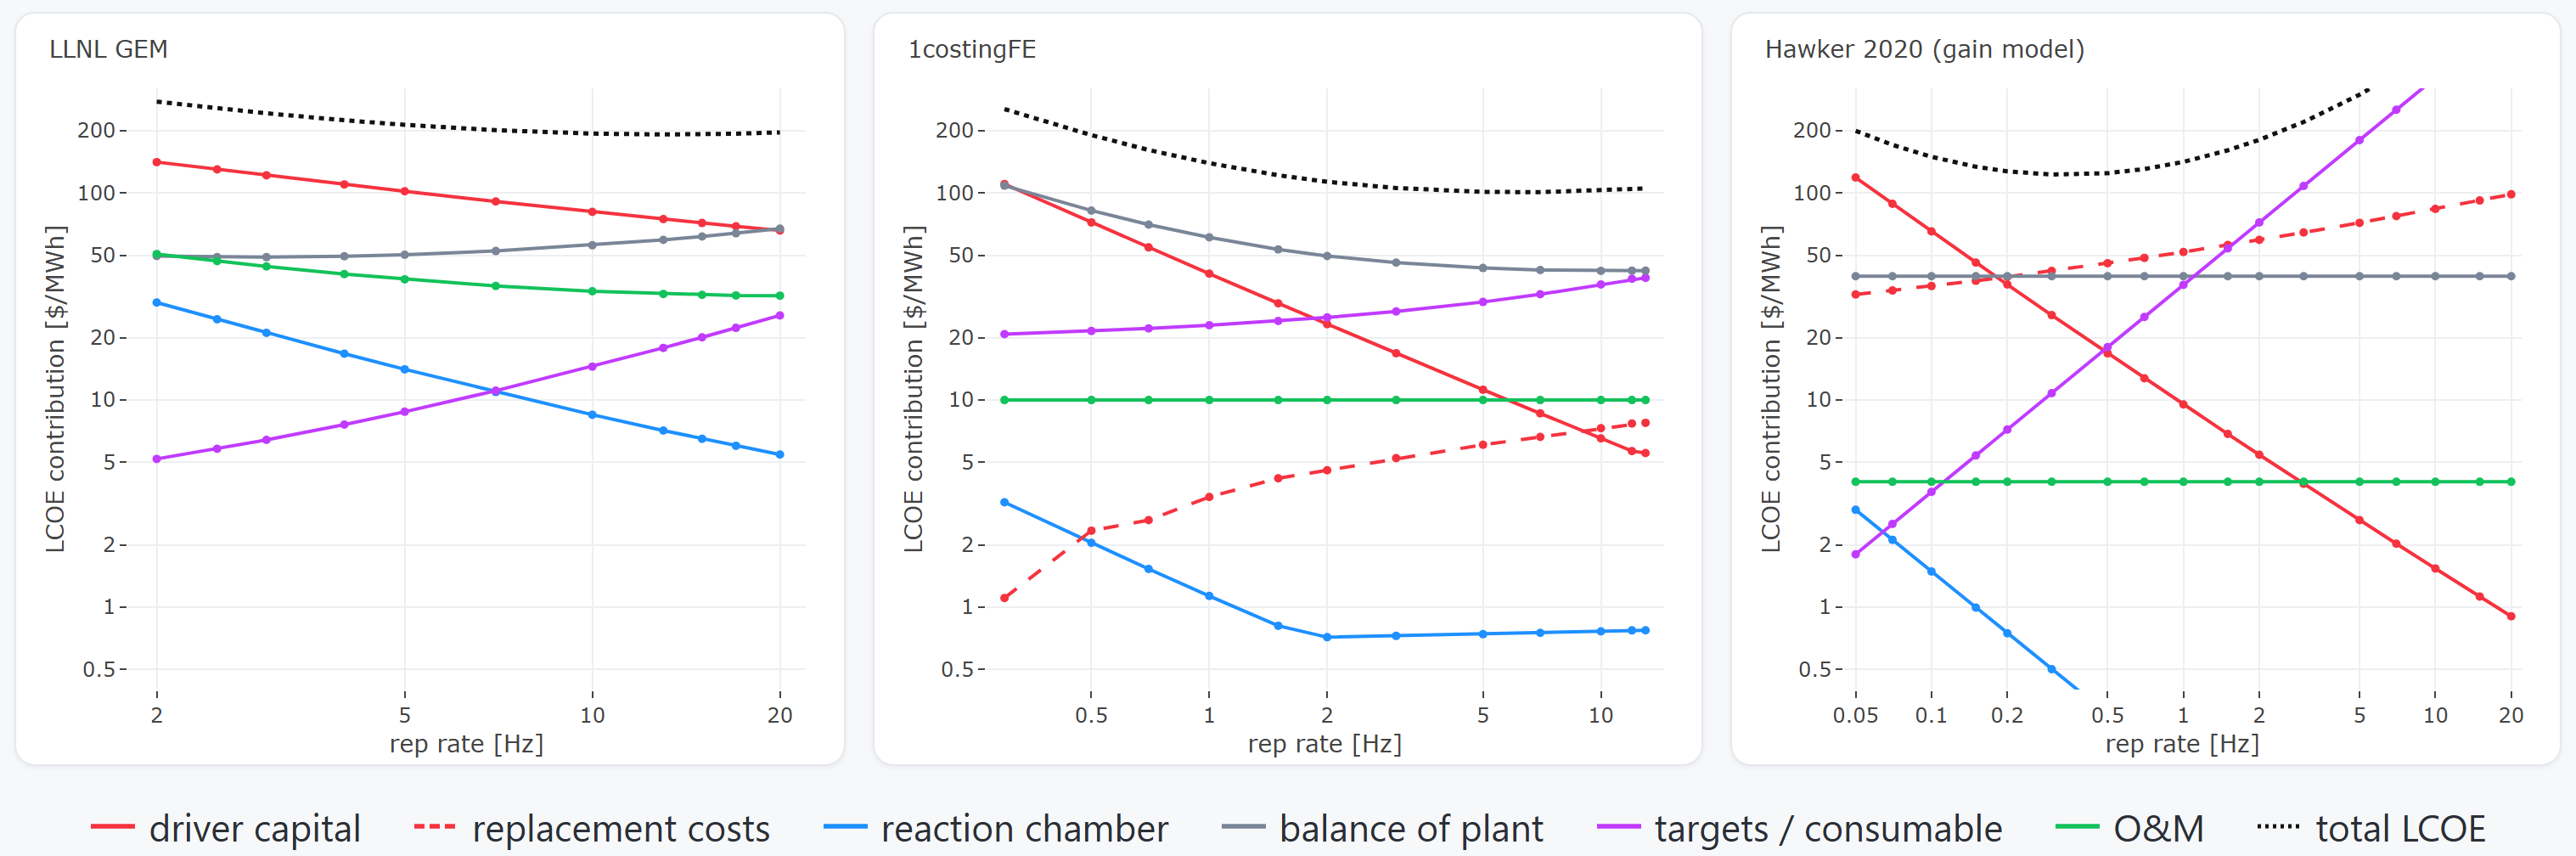
Figure 2. Rep-rate cost breakdown across three models, by account. All three panels assume a generalized DPSSL driver applied identically, so this isolates model-to-model differences rather than driver choice.
Gain physics is essentially identical across the three models — within ~15% — so the divergence is almost entirely on the cost side. All three show driver cost rising as rep rate falls. The chain is: at fixed electrical output, yield per shot scales as 1/f, and driver energy is yield divided by gain, so as f → 0 the required driver energy diverges. The gain curve offsets this only partially, since gain rises sublinearly with driver energy. Chamber cost climbs at low rep rate for the same underlying reason — larger shots demand a larger vessel. GEM’s chamber is substantially more expensive than either 1costingFE’s or Hawker’s, which pushes its optimum toward higher frequency. Hawker diverges in the opposite direction: his target and driver replacement costs are steeply rep-rate sensitive, pulling his optimum low.
We cannot say which model forecasts most accurately. What this exercise does establish is that 1costingFE sits within the range of established tools on both NOAK LCOE and its sensitivities, while resolving two things neither comparator does. It is the only model to treat shot-wear replacement by component — optics, diodes, banks — where Hawker over-penalizes rep rate by replacing the entire driver and GEM omits the cost outright. It is also the only model with a rep-rate-aware chamber floor, so high-frequency cases cannot claim an unphysically small vessel. Beyond the rep-rate question, 1costingFE offers the most detailed bottom-up treatment of target cost, target factory CAPEX, and chamber cost of the three.
Applying the model
With the model reasonably anchored, we turn it on a wider slice of the field. The exercise is combinatorial: optimize across driver types — impedance-matched Marx generators for MagLIF, DPSSLs, OEC fiber lasers, KrF gas lasers, compression-plus-ignitor pairs for fast ignition — then across target types, then across blanket and chamber configurations. Physically incompatible combinations are screened out. The relative rep-rate sensitivity of each major cost account fixes the optimal frequency, and the absolute magnitudes fix the LCOE attainable there.
Under the assumptions from the table below, two configurations stand out — one at each end of the corridor, promising for opposite reasons. Both convert their heat with a supercritical-CO₂ Brayton cycle, worth roughly 10% in conversion efficiency.
At the high-yield, low-repetition end, a gas (KrF) laser drives large targets at roughly 1 Hz through a small number of beamlines with a hybrid-drive target. The few beam ports are what make a thick liquid wall possible: a flowing curtain of FLiBe or lithium that renews itself every shot and absorbs the neutrons before they reach the structure, enabling a smaller chamber that in principle never needs replacement. Gas lasers are relatively cheap per joule-on-target; keeping the beam count low also eases tritium breeding; and a lower rep rate reduces target-factory, target-injection, chamber-clearing, and driver-cooling costs. Direct drive would be preferable on its own merits — simpler targets, better coupling efficiency — but it wants near-4π coverage, which a thick liquid curtain can’t accommodate, so a simplified hybrid drive is a compromise that could be both cost-competitive and technically feasible.
At the low-yield, high-repetition end, a solid-state fiber laser drives smaller direct-drive targets at roughly 10 Hz across many beamlines. Here the tradeoff runs the other way: fiber modules have the potential for low cost and high efficiency, with much of their supply chain shared with external markets such as telecommunications. Direct drive enables simpler targets and superior laser-to-target coupling, but its many beam paths are difficult to reconcile with a thick liquid first wall. A dry-wall configuration is assumed instead, which requires a larger chamber to manage the intense pulsed energy deposition and incurs higher first-wall replacement costs.
Idealized NOAK pulsed power assumptions
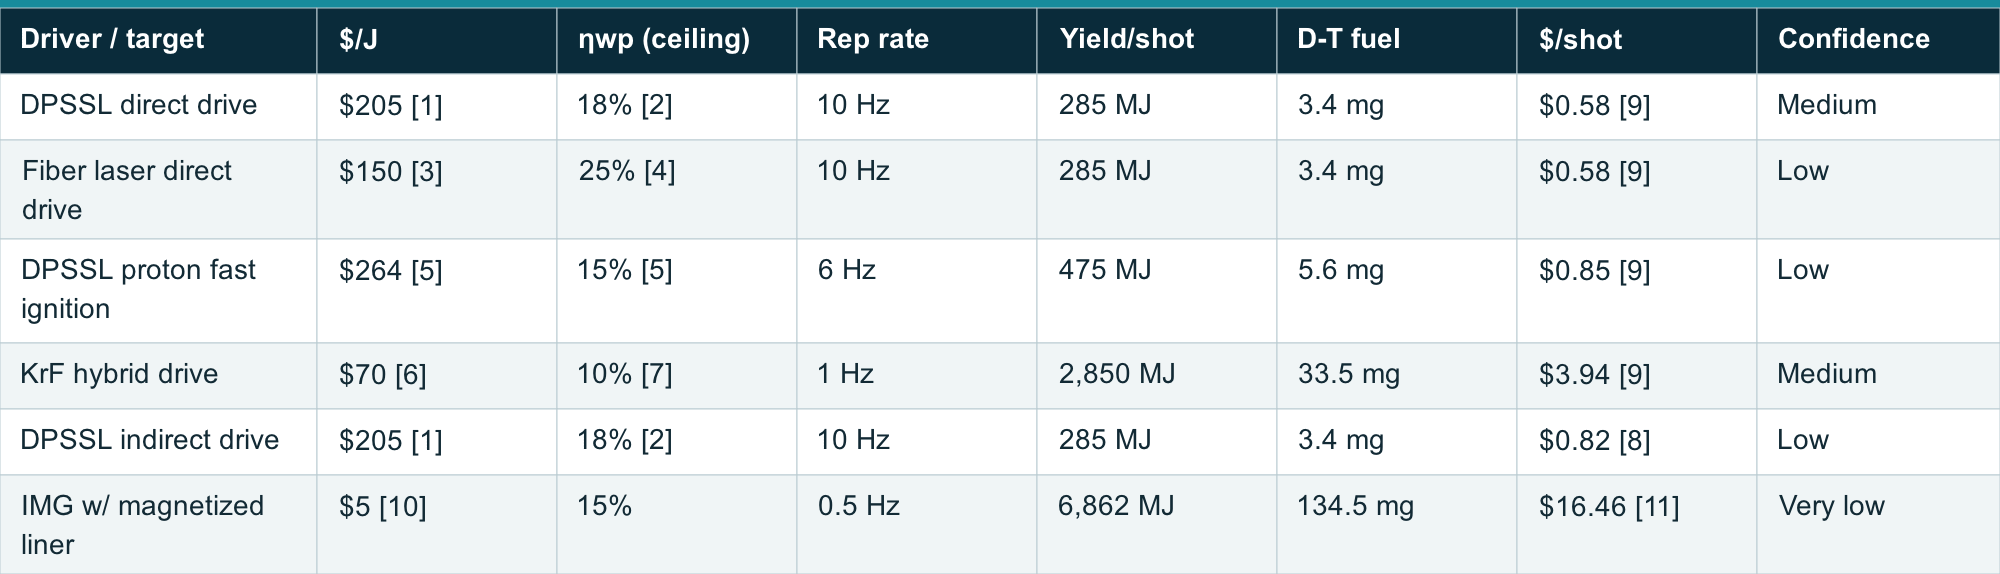
View the full table on 1cf.energy.
IV. The evidence ladder
The leading pulsed power candidates evince LCOE values roughly ten times the 1 ¢ target at reasonable NOAK assumptions. How to close the gap, if it can be closed? We organize the cost-down levers into discrete tiers. Tiers are cumulative — each carries every entry below it. Tier 0 is the NOAK design basis as captured in 1costingFE. Tier 1 is the best-case value demonstrated to date for each category at once. Tier 2 captures extrapolated values with a known mechanism. Tier 3 is speculation with no known mechanism of attainment. [12]
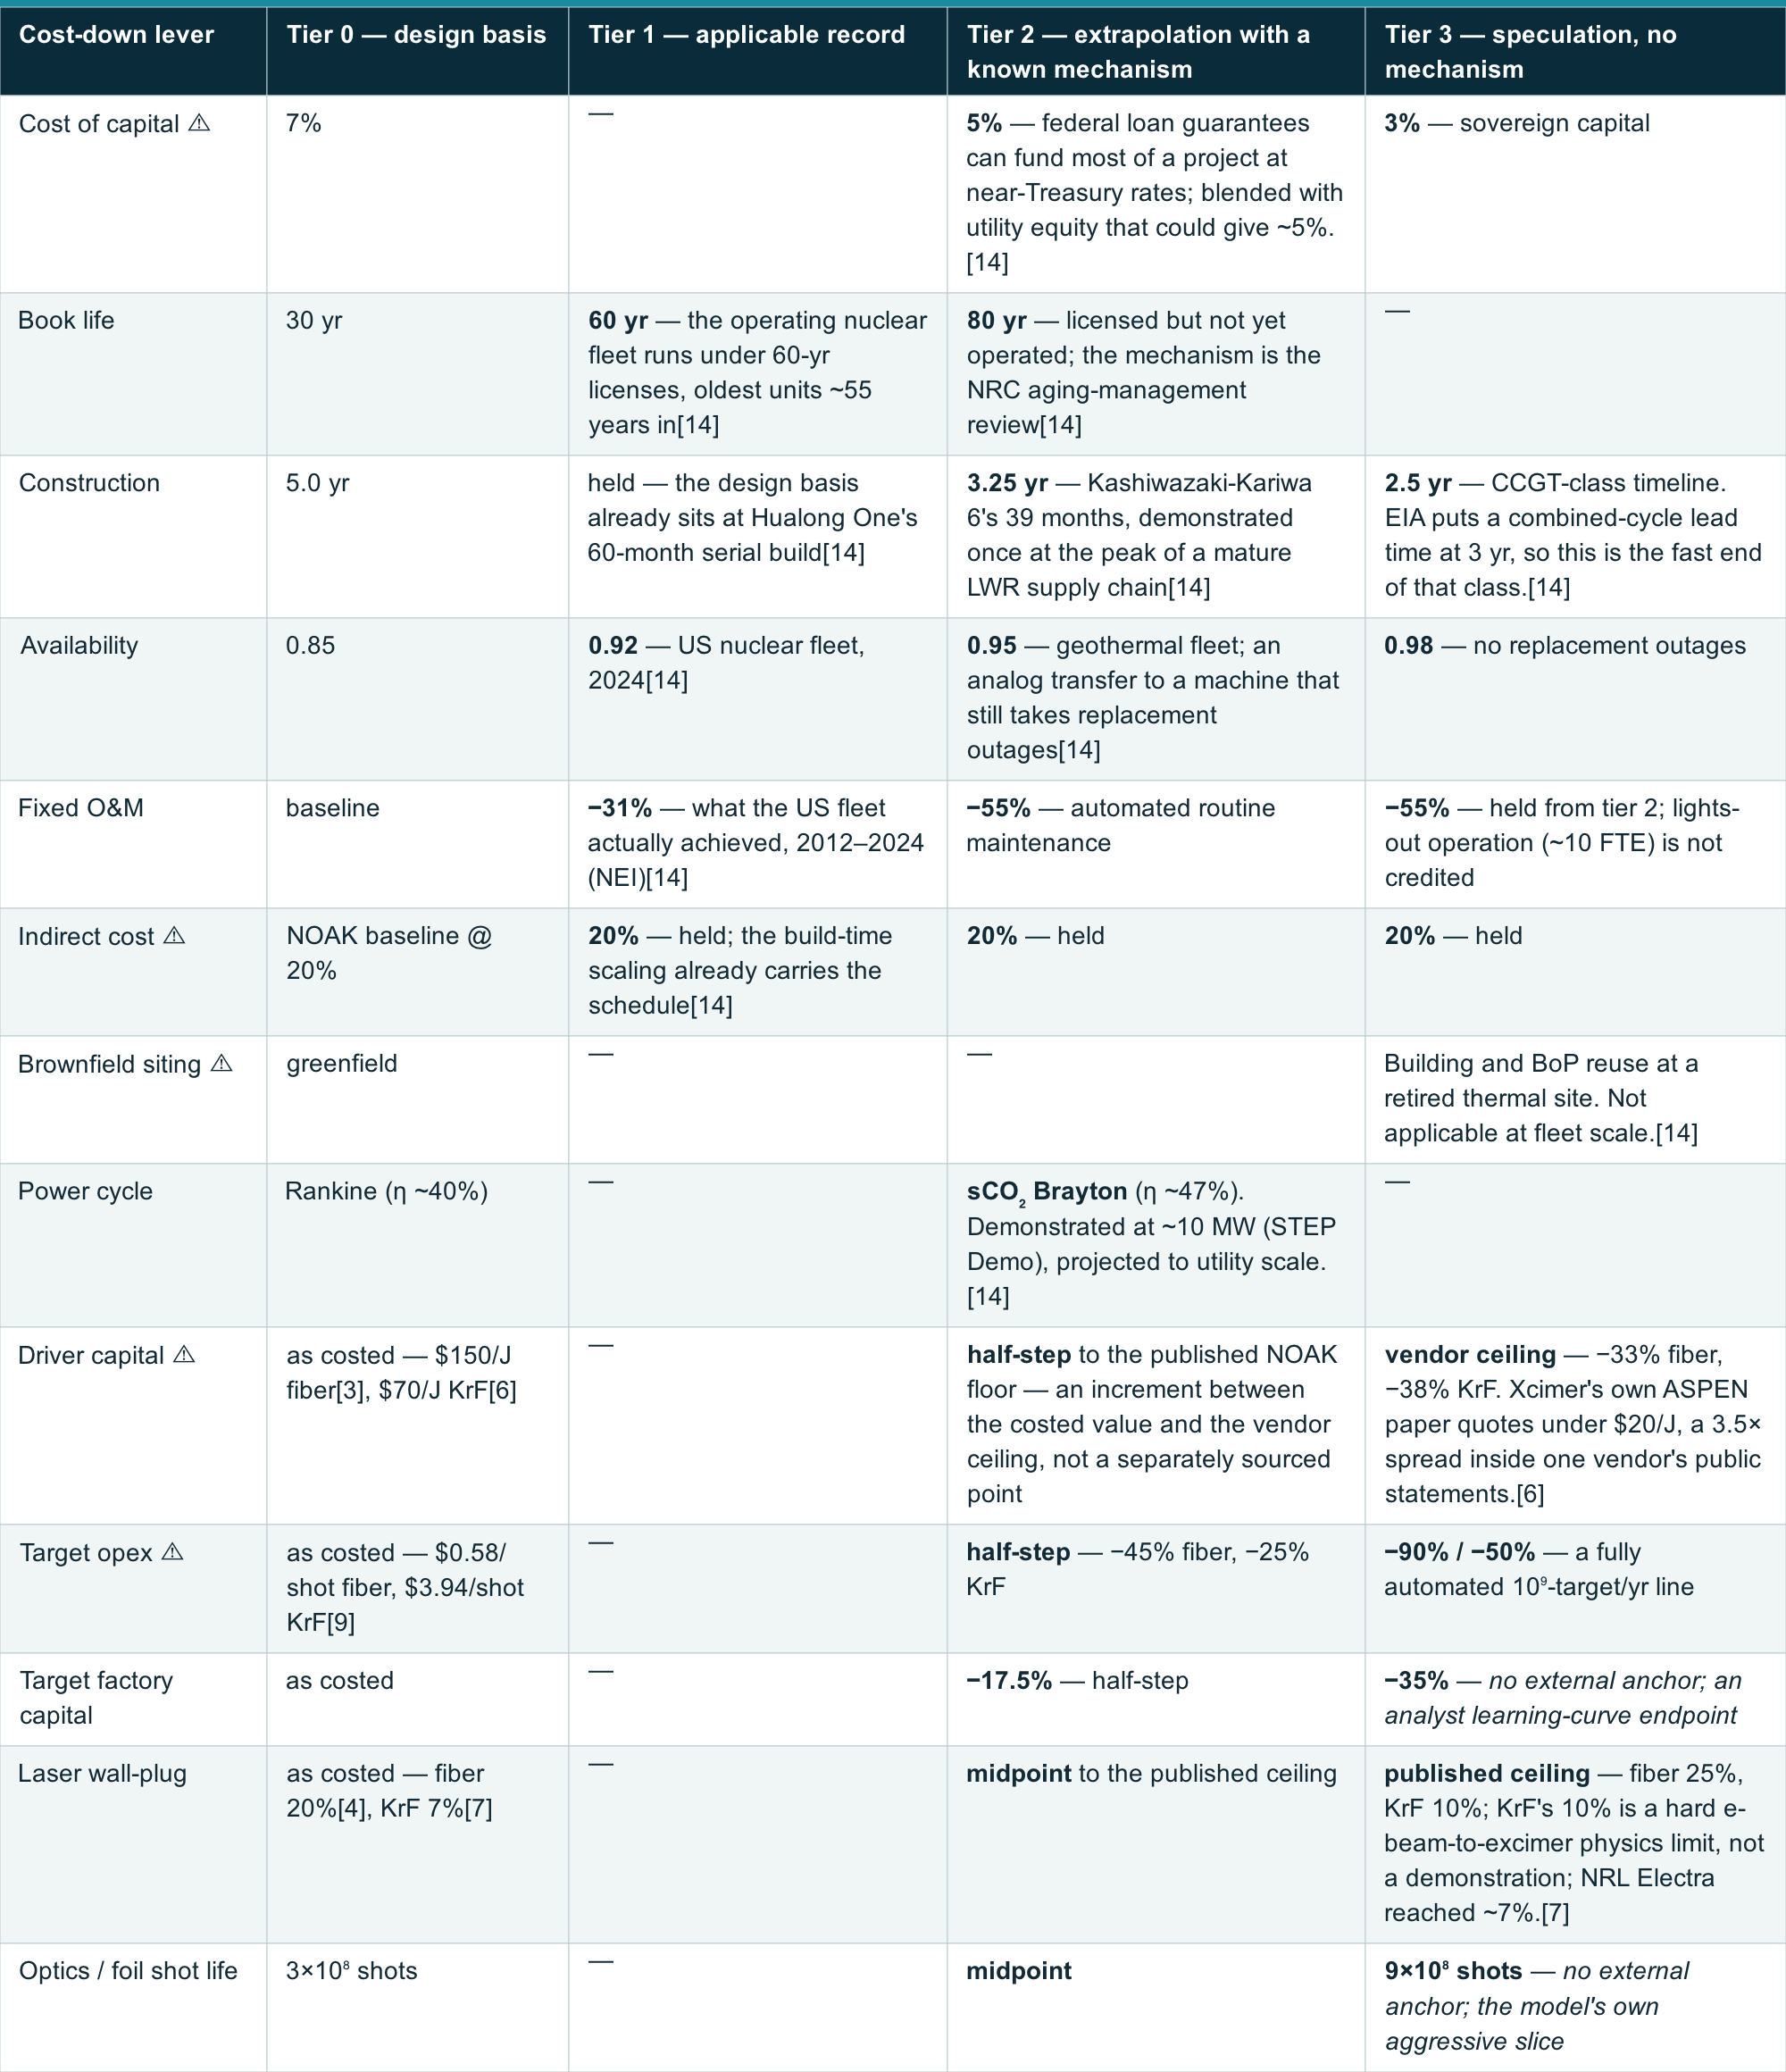
View the full table on 1cf.energy.
Both configurations are assessed at each tier at 1 GWe, with the results below. As with the mature magnetic corridor, no rung reaches the target: the speculation tier lands at 2.4 ¢/kWh for fiber/direct and 3.0 ¢/kWh for KrF/hybrid.
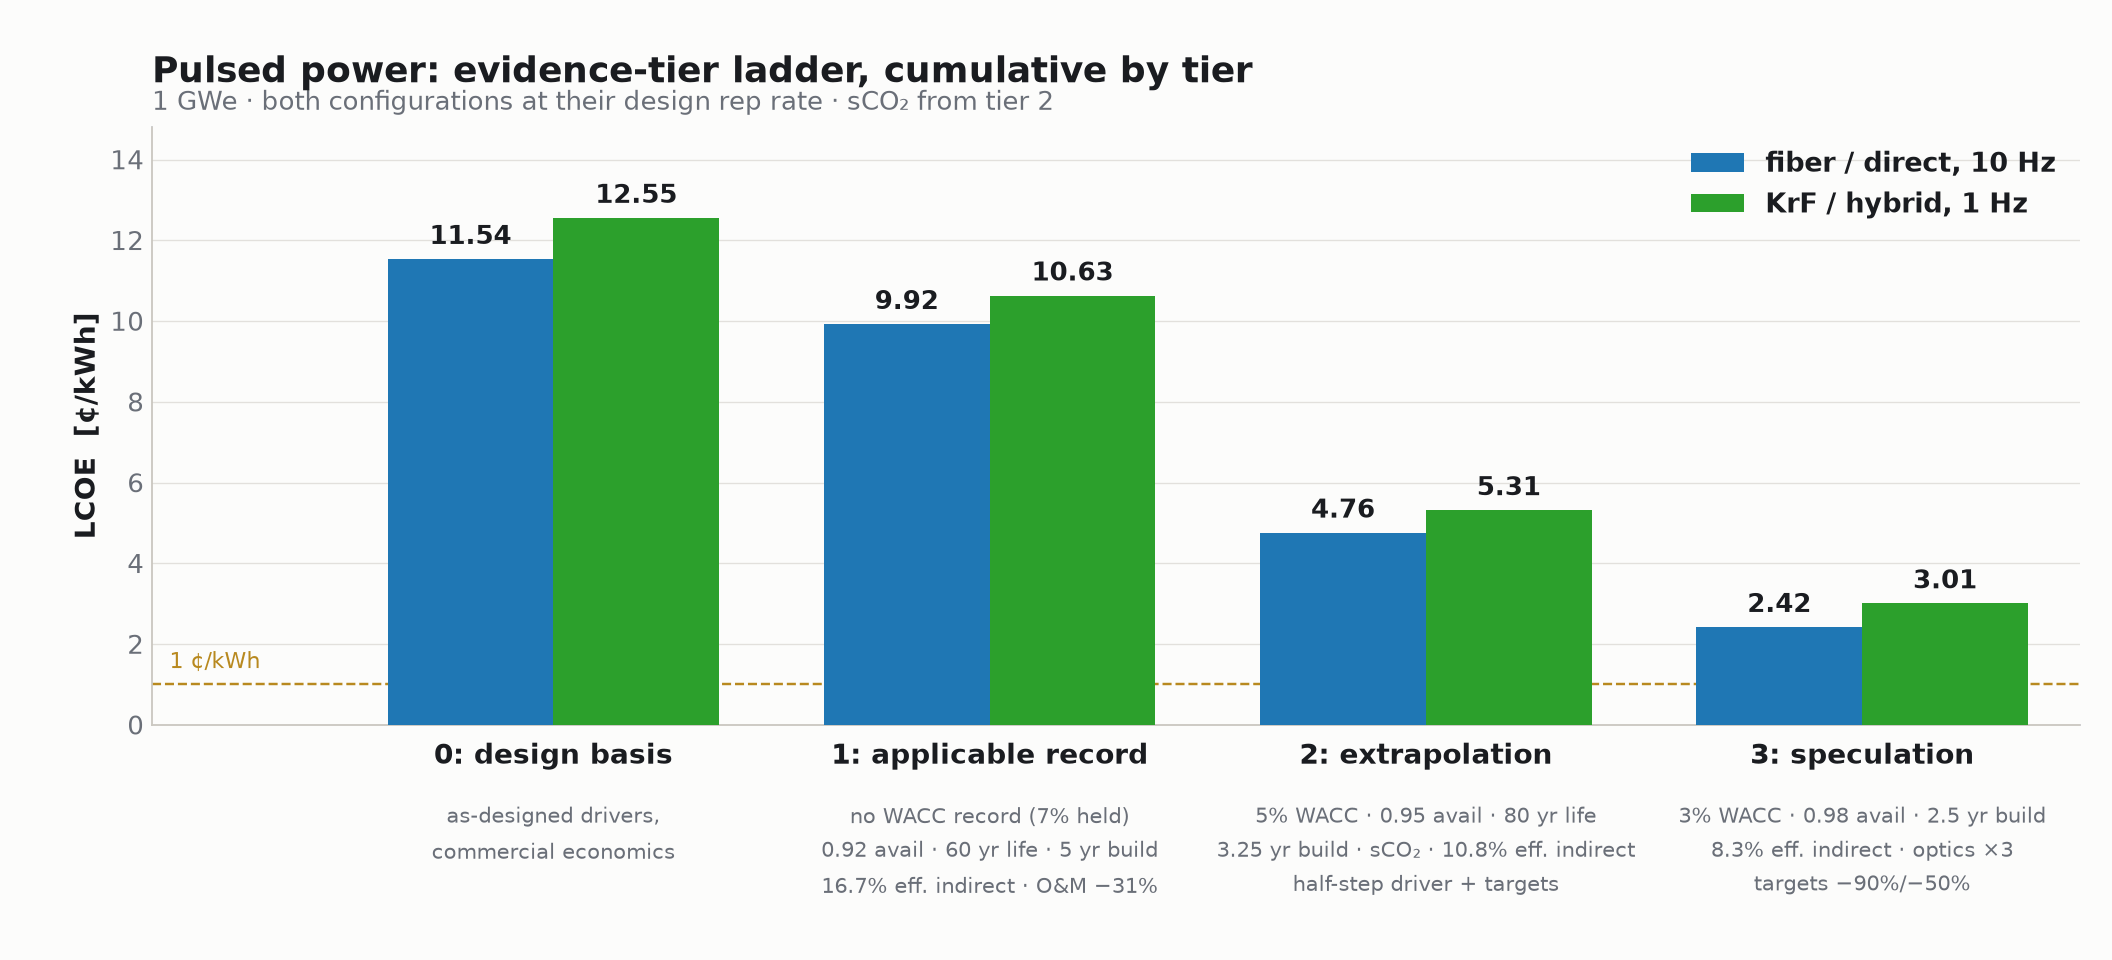
Figure 3. Evidence-tier ladder, cumulative by tier.
V. What moves the cost
Applied one at a time from the design basis, the levers rank differently for the two configurations. See the tornado plot below for isolated sensitivities. The key findings are:
Target opex is the largest technology lever for fiber laser/direct drive at ~2.5 ¢/kWh but only ~1.1 ¢/kWh for KrF, because a 10 Hz plant fires ten times as many targets.
The power cycle is the largest technology lever for KrF and the second-largest for fiber, after target opex. It is also the one with a demonstration behind it, at roughly 10 MW.
Cost of capital still leads outright. As in the mature magnetic corridor, the largest lever in a pulsed plant is not a property of the plant.
Driver capital and wall-plug efficiency rank lower in importance for fiber laser/direct drive— In the 10 Hz fiber laser configuration, the high repetition rate enables a smaller driver, making the plant less sensitive to driver CAPEX. As for wall-plug efficiency, improving η_in yields diminishing returns at higher starting Qeng values.
These results can be replicated within our 1costingFE codebase.[13] We welcome correspondence on our modeling assumptions and methodology at 1cf.energy/contact.
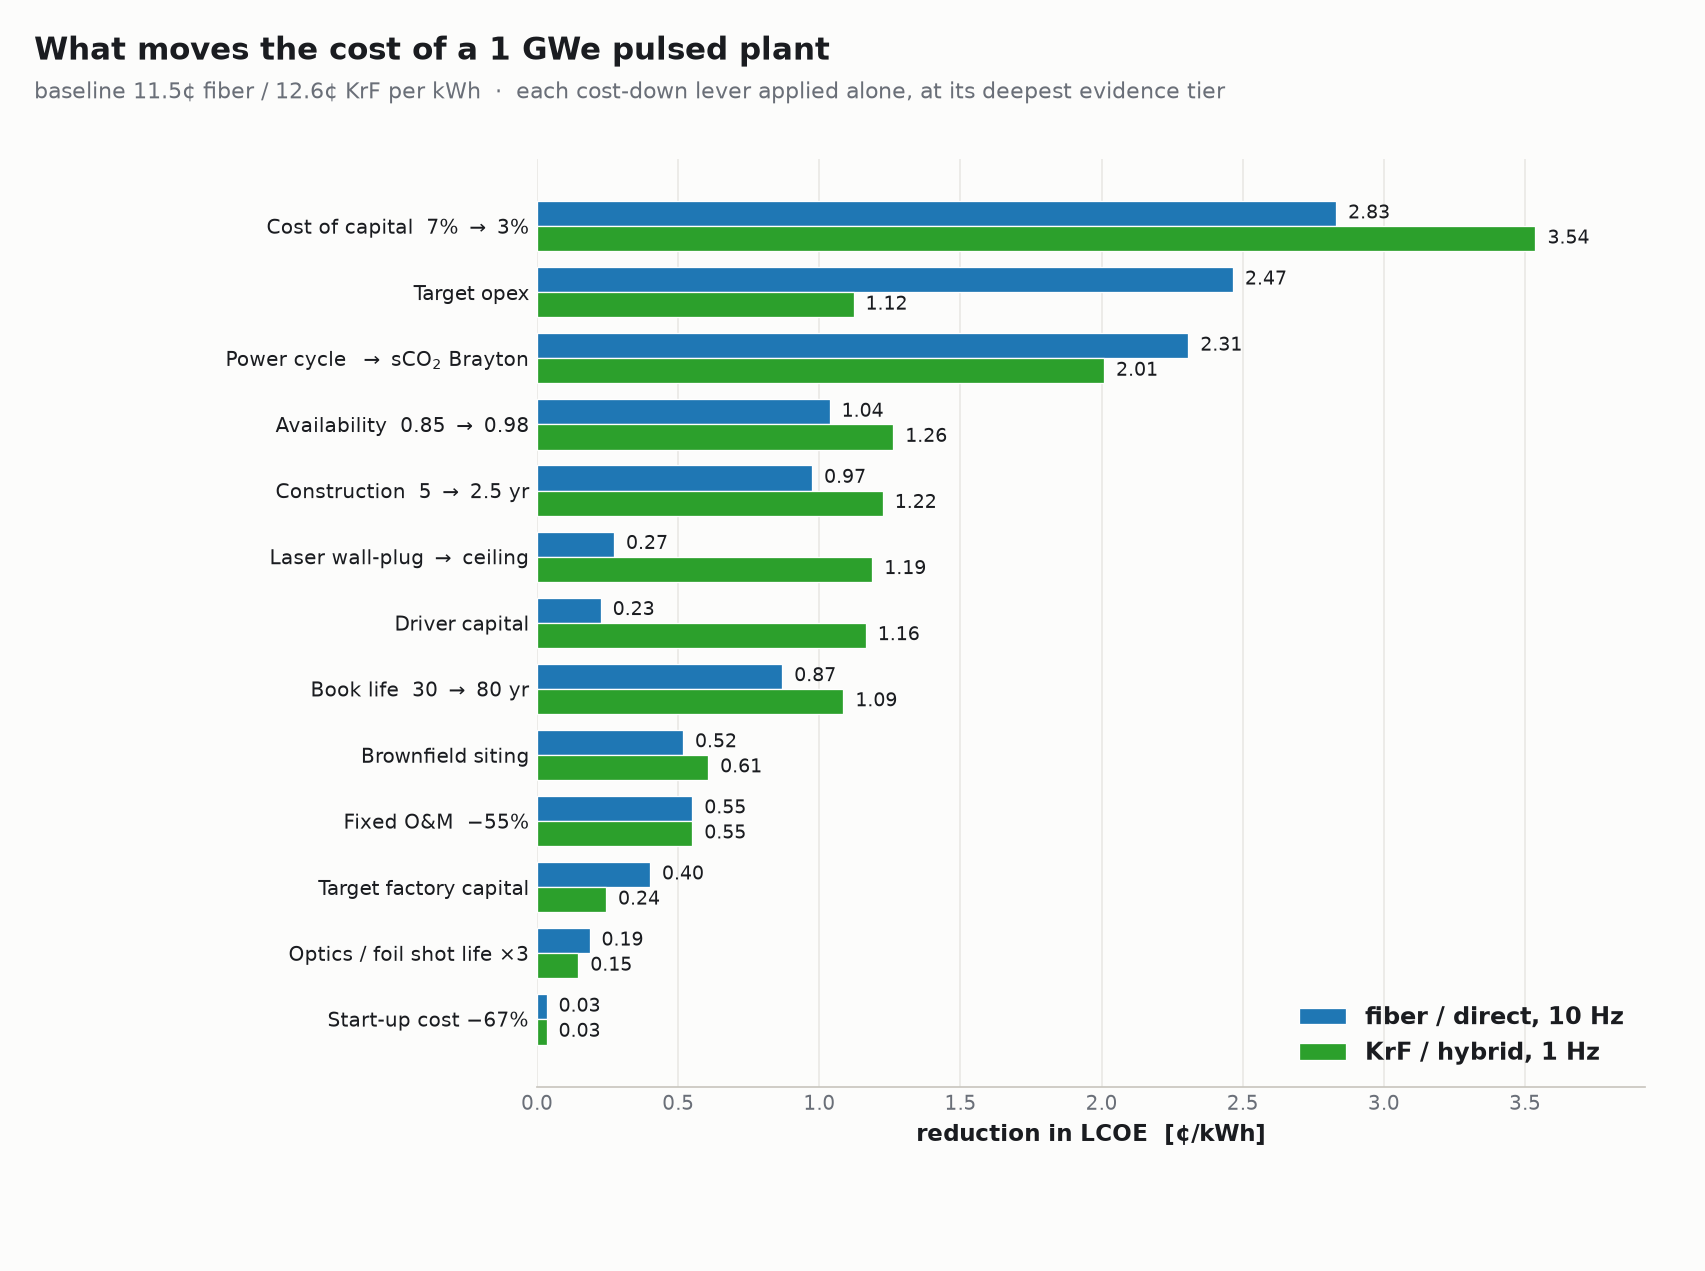
Figure 4. What moves the cost of a 1 GWe pulsed plant.
VI. Conclusion
Optimism beyond even the speculation tier is required to reach 1 ¢/kWh. Pushing every lever past the corridor’s bounds — WACC to ~1% on sovereign, near-zero-cost capital, consumables to near-free through a fully automated 10⁹-target/yr line, an advanced self-healing first wall, and scale-up to multiple GWe — brings the fiber/direct concept just to ~1.0 ¢/kWh. The KrF/hybrid concept bottoms out near ~1.2 ¢ under the identical stack: its cost is concentrated in the consumable and the driver rather than the wall or the financing, so the remaining levers cannot reach it.
The NOAK LCOE for each of these pulsed-power configurations will likely be closer to 10 ¢/kWh than to 1 ¢/kWh — and the uncertainties in each model are wide enough that any of the serious players in the field could still emerge as the frontrunner. Our aim has been to make those key sensitivities legible, and to sketch the plausible corridors a commercial pulsed-fusion plant might traverse as the physics and the cost assumptions become anchored.
§ Appendix — basis of estimates
[1] DPSSL driver, $205/J
1costingFE aggressive-NOAK anchor. Xcimer cites $700–1000/J as the conservative comparison, so this sits roughly 4× below the skeptical case and reads as a learning-curve endpoint rather than a current price. For scale, NIF’s flashlamp-pumped glass is variously quoted at $1,700–3,000/J delivered.
[2] DPSSL wall-plug: 15% as costed, 18% at the ceiling
Set by the product of diode efficiency, storage/extraction, and 3-omega UV conversion, with the harmonic conversion stage the binding term. LIFE-class projection; Mercury demonstrated roughly half this. The design basis is costed at 15%, near the demonstrated value; 18% is the ceiling, and DPSSL is not one of the two configurations the ladder carries.
[3] Fiber driver, $150/J
Interpolated on the ordering KrF < fiber < DPSSL. No vendor anchor has been found.
[4] Fiber wall-plug: 20% as costed, 25% at the ceiling
The design basis runs the fiber driver at 20%, the current figure; the ladder lifts it to 25% at the speculation tier, the vendor’s IR figure less beam-combining and second-harmonic losses. Two limitations are retained. First, BLF’s own reactor paper nets its full chain — fiber, enhancement cavity, conversion to 0.35 μm — at about 10% wall-plug-to-UV; costing the design basis there raises the fiber row by about $16/MWh (+14%) at 10 Hz, with the recirculating fraction going from 16% to 27%, and lifts every rung of the fiber ladder by a similar share. Second, the 25% ceiling is credited at the second harmonic (532 nm, green), while direct drive wants the third (351 nm) for ablation pressure and LPI margin, so the ceiling is optimistic for the target in the same row. This remains the most exposed cell in the table.
[5] Proton FI, $264/J and 15%
Analyst 80/20 blend of compression driver and ignitor, with the ignitor carrying a $500/J CPA premium (LLNL-PROC-769117). The cost arithmetic is exact: 0.8 × $205 + 0.2 × $500 = $264/J. The 15% is consistent with energy-weighted blending at an ignitor wall-plug near 9%, a reasonable diode-pumped CPA figure. The residual uncertainty is in the FI gain credit and the 80/20 split, not the blend. Ignitor cost is dominated by compressor gratings, which are aperture-limited by damage threshold and are also a per-shot wear item.
[6] KrF driver, $70/J
Xcimer/TRUMPF whitepaper NOAK range of $60–80/J on target. Consistent with Xcimer’s public claim of 30× below NIF (~$57/J against NIF at $1,700/J). Their 2022 IFE Workshop paper on the ASPEN laser quotes a more aggressive figure of under $20/J for up to 12 MJ — a 3.5× spread within their own public statements, worth noting given the whole row hangs on one vendor.
[7] KrF wall-plug: 7% as costed, 10% at the ceiling
Hard e-beam-to-excimer physics ceiling; the literature range for KrF is 5–10% and NRL Electra demonstrated ~7%. The design basis is costed at the demonstrated 7%; the ladder lifts it to the 10% ceiling at the speculation tier.
[8] Indirect drive
Same DPSSL driver as the direct-drive row; the extra uncertainty is hohlraum X-ray coupling. The table shows the same $/J, wall-plug, repetition rate and yield because those are inputs. The ~2× energy penalty enters through the model’s coupling factor (0.5 for indirect drive against 1.0 for direct), so the same 285 MJ yield takes about 5.8 MJ of driver energy instead of 2.9, roughly doubling driver capital and cutting q_eng from 5.0 to 3.3. The $/shot difference ($0.82 against $0.58) is the hohlraum’s high-Z material floor, scaled with the shot. Together they put the indirect row about a third above direct drive at 10 Hz.
[9] Consumable cost
The $/shot column is the model’s target-fabrication cost, not a fuel price: a capsule anchor of $0.50/shot at 2.75 mg of DT, scaled with the assembled fuel mass — cryogenic layering in proportion to mass, coating with area, a flat $0.10 for fill, assembly and QA — which reproduces each row ($0.58 at 3.4 mg, $0.85 at 5.6 mg, $3.94 at 33.5 mg). It carries no tritium price because the plant breeds its own; the only purchase is the startup inventory, about 1.3 kg at $30,000/g ($40 M), charged once. One limitation is retained: the hybrid target’s lined cavity and burn-through window are costed on the capsule scaling, so the KrF row’s consumable is a lower bound, and the target-opex lever on the ladder moves it down from there, not up.
[10] IMG driver, $5/J
Derived as $0.50/J stored divided by ~10% coupling to the load, which is consistent with Z-class stored-to-load ratios. The stored-energy figure is the aggressive part: current pulsed power runs $5–15/J stored, and Pacific Fusion’s own Demonstration System is roughly $6/J stored. $0.50/J is therefore ~12× below the nearest vendor number and rides a steep learning curve.
[11] IMG consumable, $16.46/shot
Costed on the model’s liner basis: liner metal at $3.00/shot for the 46.2 mg reference mass, scaled with fuel mass to 134.5 mg and marked up 1.3× for forming, plus a recyclable transmission line carried as a flat $5.10/shot remanufacturing allowance rather than as a mass. The line is carried as recycled, not consumed: on the 2003 Sandia baseline of ~50 kg of steel per shot, raw material alone would exceed this figure, so the cell is a lower bound that depends on RTL recycling. IMG is not one of the two configurations the ladder carries, so it moves only the landscape.
[12] How the ladder is built
Tiers are cumulative — each carries every entry below it. Driver capital, target opex, target factory capital, laser wall-plug and optics shot life have a sourced design-basis value and a sourced ceiling but nothing in between, so the tier-2 entry is the midpoint of the two: an increment between baseline and ceiling, not a separately sourced operating point. The sensitivity chart applies the same levers one at a time from the design basis to the deepest value the ladder reaches, so its bars do not sum to the ladder’s descent.
Normalization. Every row is sized to 1 GWe net electric (pulsed_corridor.py runs each concept with net_electric_mw = 1000 and size_from_power), so yield × repetition rate is the fusion power each concept needs to deliver 1 GWe after its own recirculation. That is why IMG’s fusion power runs above the laser rows: with the lowest wall-plug efficiency in the table it recirculates a larger share of its gross output than the laser rows (about a fifth for DPSSL on the model’s power balance), so it needs more fusion power for the same net output.
[13] Reproducing this
pulsed_corridor.py writes corridor_data.json; corridor_tiers.py carries the reduced pulsed model, which reproduces the full 1costingFE LCOE at baseline, and computes the evidence ladder. tier_ladder_figs.py draws the ladder chart and pulsed_tornado_plot.py the sensitivity chart.
[14] Sources
Lawrence Livermore National Laboratory, GEM inertial fusion energy cost model. N. Hawker, A simplified economic model for inertial fusion (2020).
Xcimer Energy / TRUMPF, commercialization whitepaper (Feb 2026) — KrF $60–80/J on target. Pacific Fusion, AMPS paper, arXiv:2504.10680 — MagLIF driver anchor. LLNL-PROC-769117 — CPA ignitor premium. NRL Electra — KrF wall-plug demonstration.
US EIA and American Nuclear Society, 2024 US nuclear fleet capacity factor — availability, tier 1. US DOE Geothermal Technologies Office — fleet availability, tiers 2–3. US NRC license renewal and subsequent license renewal (Turkey Point 3–4, Peach Bottom 2–3, Surry 1–2) — book life. CNNC Hualong One, 60-month construction; TEPCO Kashiwazaki-Kariwa 6 ABWR, 39 months — construction schedule. US EIA, Cost and Performance Characteristics of New Generating Technologies, Annual Energy Outlook — combined-cycle lead time 3 yr, tier 3. Nuclear Energy Institute, Delivering the Nuclear Promise — operating cost reduction. Georgia Power borrowings under the DOE Title XVII loan guarantee, 2.18 to 2.43% on the guaranteed tranche — cost of capital, tier 2; the blended ~5% assumes the statutory leverage allowance, which no plant has used in full. Korean APR1400 and CNNC Hualong One indirect-cost fractions, via the 1costingFE CAS30 account justification — indirect cost, tiers 1–2. US DOE/NETL, Quality Guidelines for Energy System Studies, EPCM basis — indirect cost, tier 3 only. Argonne / Idaho / Oak Ridge National Laboratories, Investigating Benefits and Challenges of Converting Retiring Coal Plants into Nuclear Plants (2022) — brownfield siting. GTI Energy / Southwest Research Institute / GE Vernova / US DOE-NETL, STEP Demo supercritical CO₂ pilot plant, 10 MWe rated — power cycle.
Target factory capital and optics / foil shot life carry no vendor or published figure at any tier; their tier-2 and tier-3 entries are analyst learning-curve endpoints from the model’s own aggressive slice, and are labelled as such in the table. The fiber driver’s $/J likewise has no vendor anchor — see [3].
1cFE Corridor Dispatch · Pulsed Power · costed on 1costingFE
Originally published at 1cf.energy.