

I. Introduction
This corridor to low-cost fusion energy is the field’s control experiment, with the strongest evidence base of any confinement category. Steady-state D-T magnetic confinement machines include more than a hundred tokamaks operated since the 1950s alongside a deep stellarator lineage.
Compared to other fusion concepts, relatively little new science is required to reach commercial tokamak or stellarator operation; the gains needed are principally engineering and economic. Success will then be determined not only by reliable plasma physics with minimal disruptions, but also by achievable capital cost and uptime, driven largely by fast neutron damage control.
The floor: 2.6 ¢/kWh
A mature D-T magnetic plant does not reach our long-term cost target of 1 ¢/kWh ($10/MWh). It gets to $25.95/MWh, and only on full speculation — sovereign capital, an 80-year book life, REBCO an order of magnitude below today’s price, and a first wall that survives three times its design basis.
What carries the cost-floor descent: financing, schedule, and the magnet cost account. What could break the conclusion: the first-wall fluence limit — a high-leverage input with the least empirical support, driving not only replacement costs but also plant uptime.[5]
II. There is no consensus on the best magnetic architecture
A reader approaching the magnetic-confinement literature for the first time might reasonably expect the field to have converged on a preferred architecture after seven decades. Yet there are champions of each major type of D-T magnetic confinement. Commonwealth Fusion is betting that its HTS coil manufacturability and mature physics will win out. The UKAEA has supported spherical tokamaks as their preferred architecture, due to its high power-density potential. And companies like Proxima Fusion and Thea Energy are pursuing stellarators for their simpler, disruption-free plasma confinement and lower recirculating power requirements. To consider all sides of the debate, let’s examine two published comparisons that reach similar conclusions from opposing angles: T. G. Brown’s 2018 “Three Confinement Systems — Spherical Tokamak, Standard Tokamak and Stellarator: A Comparison of Key Component Cost Elements” and Dennis Whyte’s 2026 “Criteria for the Economic Viability of Fusion Power Plants.”[15]
Brown: the configuration and maintenance lens
Thomas Brown’s 2018 PPPL study asks whether a magnetic fusion device can be simplified to the point of being cost competitive while operating at high availability. Its method is deliberately unlike a physics-driven cost model. Three design lineages — a spherical tokamak, the K-DEMO conventional tokamak, and a quasi-axisymmetric stellarator — are scaled to a common 1000 MWe mission and then compared on what each configuration forces the surrounding plant to be. Reactor halls are laid out against the ITER test cell as a template, maintenance paths are traced through the auxiliary systems that surround the core, and blanket segmentation is counted. Affordability is benchmarked externally, against the capital cost of a fission plant plus a premium for fusion’s safety and waste advantages.
The key difference between Magnetic Confinement Fusion (MCF) archetypes reduces to one factor: a tokamak needs a plasma current and a stellarator does not. Three consequences follow.
Stellarators carry no poloidal-field coil set, which Brown notes is among the few components that must be fabricated on site rather than shipped, due to its large diameter.
Stellarators require fewer diagnostics — the PPPL pilot-plant assessment concluded that a spherical or conventional tokamak needs five upper and lower ITER-style ports plus two midplane diagnostic ports, where a stellarator needs fewer.
Stellarators need substantially less auxiliary heating hardware, since current drive is unnecessary for stellarators.
Tokamaks and spherical tokamaks additionally face a floor on toroidal-field coil count, set by field ripple. Brown argues that since port width is bounded by the gap between adjacent coils, and blanket sector count by port width, that propagates into a higher part count. However, it must be noted that a stellarator buys its lower part count with non-planar coils that must be wound, cased and positioned to sub-millimeter tolerances. Part count can often correlate inversely with part complexity, and coil fabrication is where the tokamaks and stellarators diverge — though the literature does not agree on what cost markup, if any, stellarator coils will carry.
Another organizing claim in Brown’s “Three Confinement Systems…” is that “major radius alone is not a good metric in determining the size and cost for a fusion device.” Brown finds that the largest device examined, the stellarator, requires the smallest reactor hall; the smallest device, the spherical tokamak, requires roughly twice that volume. The cause is the negative-ion neutral beam system the spherical tokamak needs for heating and current drive, whose footprint dominates the building rather than the reactor core. Stellarators, while larger in diameter, are shorter than equivalent tokamaks, allowing for lower ceiling heights. For context, buildings were the second-largest category of ITER’s direct capital cost, after magnets.
Brown’s verdict is as follows: stellarators have the best chance of economic success, provided the underlying physics can be authenticated. This, Brown asserts, is primarily due to their lower building costs and lower part count. The next section surveys the MCF field from another angle. Brown compares practical building, part count, and maintenance considerations across three specific machines; Rutherford Energy Venture’s Dennis Whyte et al. construct a concept-agnostic economic criterion, normalized to the surface surrounding the plasma, which we use to compare MCF archetypes.
Whyte: the areal-economics lens
Dennis Whyte and colleagues, in Criteria for the economic viability of fusion power plants, construct a concept-agnostic economic framework by analogy with the Lawson criterion. All fusion power must pass through a control surface S surrounding the plasma, so both revenue and the dominant costs can be normalized to that surface. The resulting figure of merit, Q_econ, is the ratio of economic gain to economic cost, with viability requiring Q_econ ≥ 1.
The framework’s central and most consistent result is a threshold in areal fusion power density: across a wide sweep of the ten controlling parameters, Q_econ = 1 requires P_f/S of approximately 2 MW/m², and a commercially interesting Q_econ ≥ 1.5 requires approximately 3 MW/m². The authors state that this “lays to rest the idea that an arbitrarily low power density is attractive because it will prolong the usable lifetime of the S and blanket components.”
The costing framework is fully defined in Whyte’s paper, and can be applied directly to published design points as captured in our adapted code. The results do not automatically favor the highest power-density configuration, as one would expect.
The figure below plots economic gain against the assumed first-wall fluence limit, computed directly from Whyte’s closed-form expressions. First-wall fluence is the swept variable because it sets how much cost risk a design can absorb: the stellarator reaches economic viability at lower fluence limits than the tokamaks, meaning less materials innovation would be required under the input assumptions below. Three ARIES plants supply the inputs — ARIES-AT for the conventional tokamak, ARIES-ST for the spherical tokamak and ARIES-CS for the stellarator — all optimized to minimize LCOE at a common 1000 MWe net output. Inputs are normalized wherever possible to enable apples-to-apples comparison; for example, power conversion efficiency is standardized at 40%.
Input assumptions
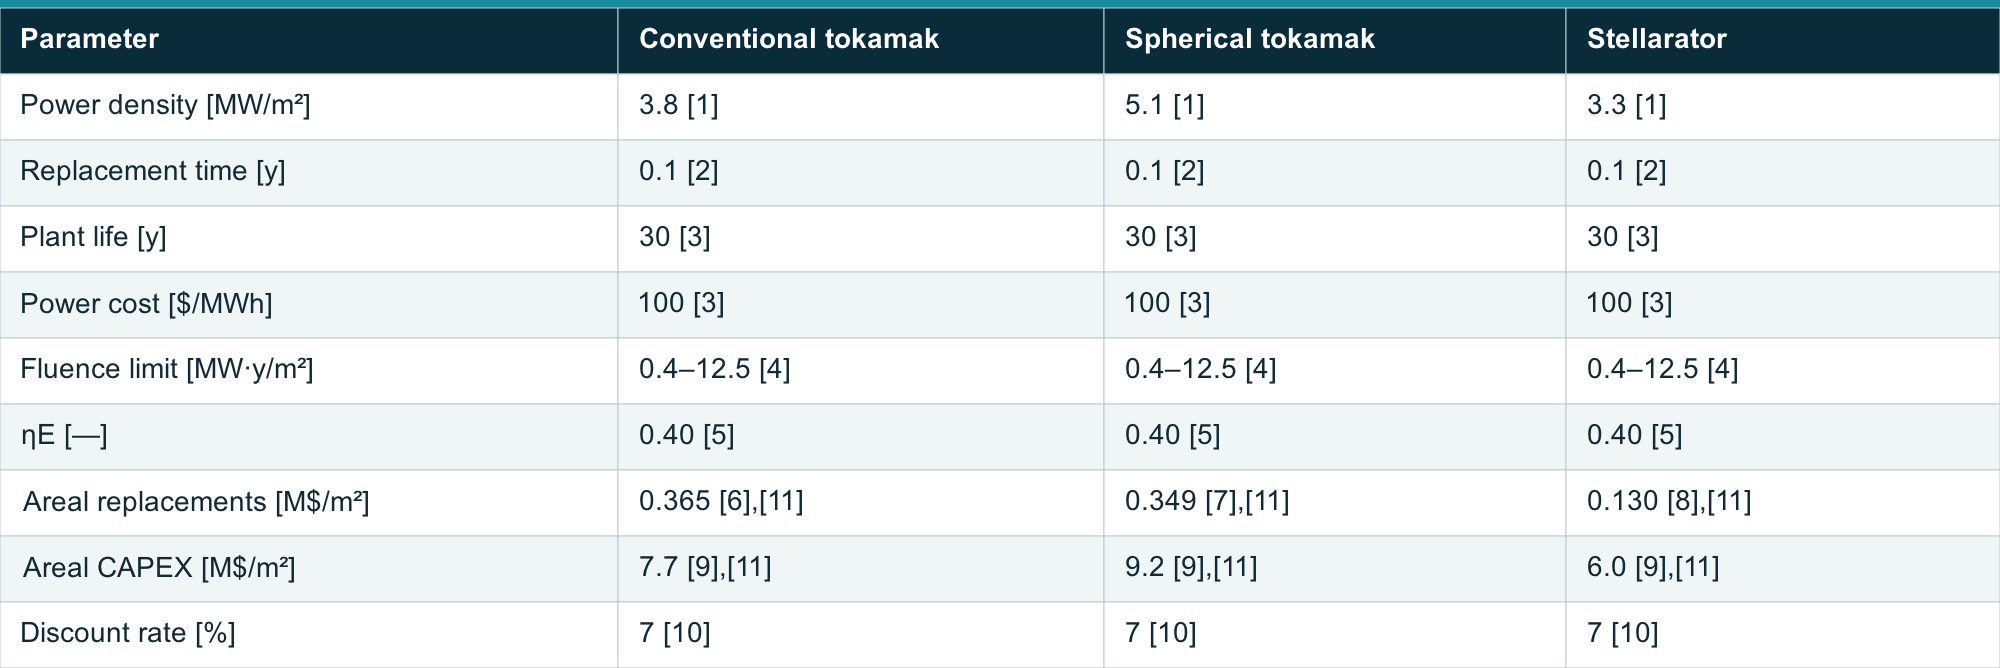
View the full table on 1cf.energy.
(1) Whyte Table 3 — ARIES-AT, ARIES-ST, ARIES-CS respectively.
(2) Whyte Table 2 base case. Held common, but may differ by architecture.
(3) Whyte Table 2 base case, no design dependence.
(4) Swept variable — the horizontal axis, 0.4 to 12.5 MW·y/m², equal to 3 to 100 dpa via X_S = L_dpa / (0.8 · F_dpa) with F_dpa ≈ 10.
(5) Normalized, not sourced. The ARIES designs assume different power-conversion efficiencies; all three are held at 0.40 here so the areal-cost comparison is not confounded by cycle choice.
(6) Mean of the two ARIES tokamaks, Whyte §6.2: ARIES-AT 0.32 and ARIES-RS 0.41.
(7) Not published. Derived by applying the ARIES tokamak mean blanket fraction of direct cost (3.8%) to ARIES-ST’s own direct cost and surface: 0.038 × $5,330M / 580 m².
(8) ARIES-CS as published, Whyte §6.2. This single unreplicated number carries most of the separation in the result — the lowest blanket fraction of any ARIES design (2.3% of direct cost) spread over the largest surface in the set (750 m²). At the tokamak average of 3.8% it would be 0.215.
(9) Whyte Table 3.
(10) A commercial WACC.
(11) Uncertainty band −40% / +100%, applied to both cost rows together. The low side is supported by the spread within the ARIES set itself; the high side by an independent bottom-up estimate of the blanket account.
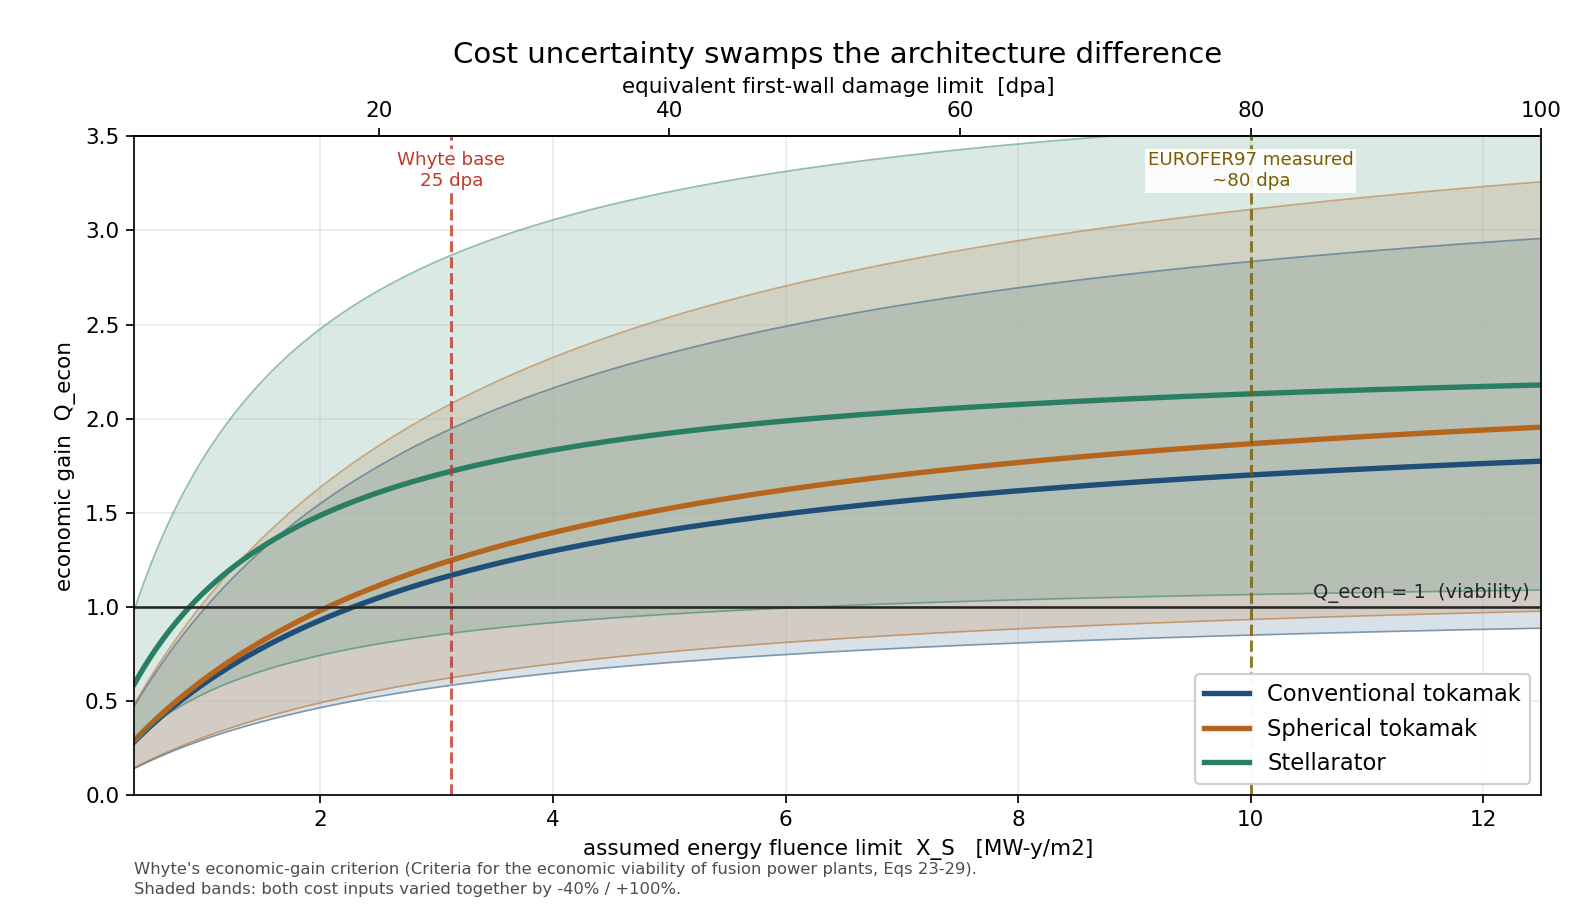
Figure 1. Economic gain against assumed first-wall fluence limit.
The stellarator leads at every damage limit, though the lead narrows as materials improve. The reason is almost entirely the two areal cost figures, capital and replacement, which Whyte derives from the ARIES designs; its lower areal costs more than compensate for its inferior power density. The uncertainty bands overlap at every damage limit, so on this evidence the future corridor leader could be any of the three archetypes. The figure is reproducible from a standalone script that implements Whyte’s equations directly and was validated against the worked example in his paper.
Choosing an architecture for the corridor
Neither published analysis settles the question. Brown’s configuration lens selects the stellarator on plant footprint and part count, hedged on physics validation. Whyte’s areal-economics lens also favors it under the assumptions above, but with large uncertainty bands. Opinions in the field vary significantly, and a reader who weighs physics maturity above everything else would reasonably choose the conventional tokamak instead.
Weighing the published evidence together with our own assessment of where each architecture is exposed, we select the stellarator as the representative of this corridor. The matrix below records our qualitative assessment of the key tradeoffs: nine axes, derived from the publications of T. G. Brown (PPPL), Dennis Whyte (MIT PSFC), the ARIES studies, and the UKAEA STEP design documentation.
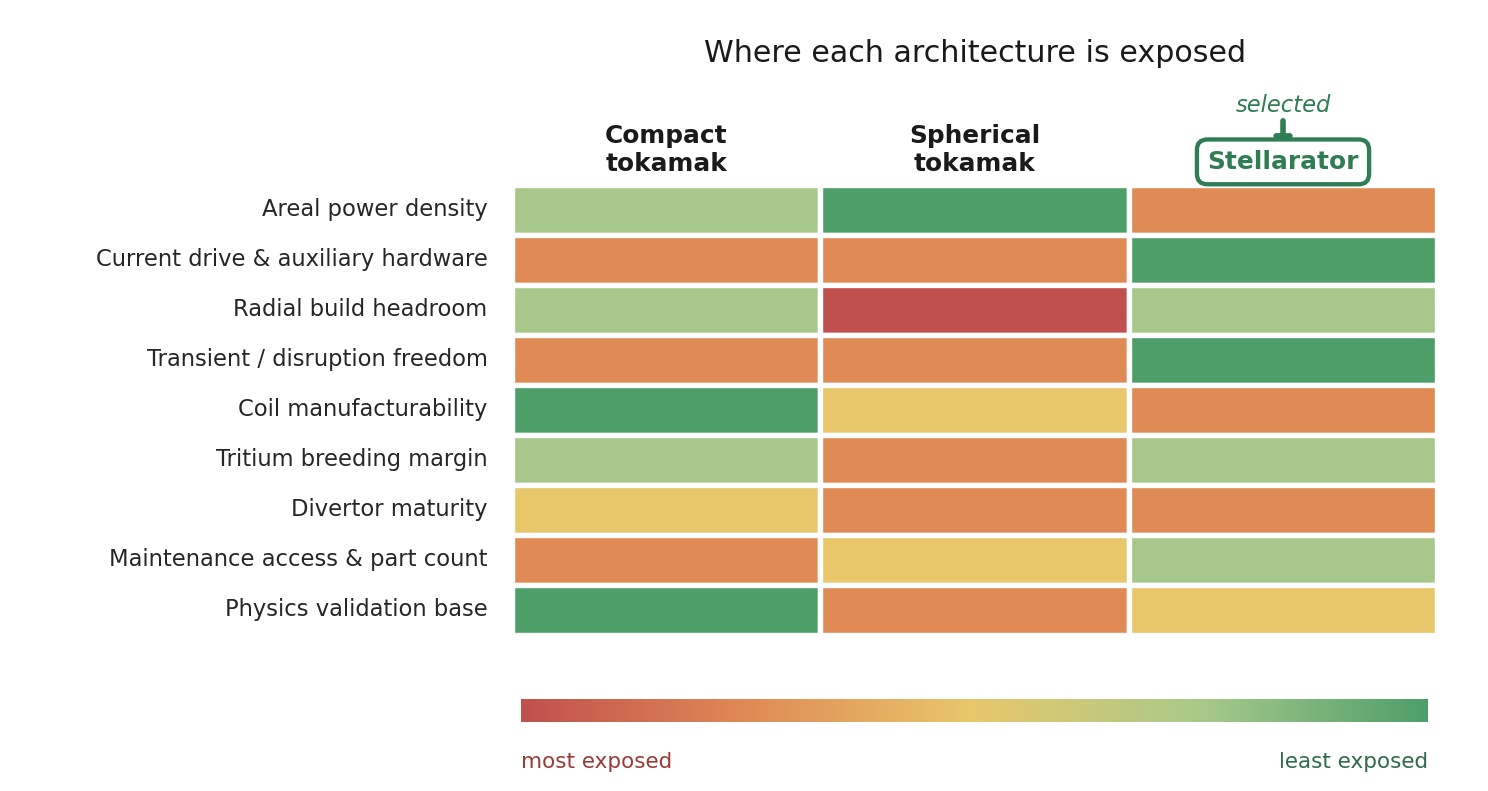
Figure 2. Magnetic Confinement Fusion (MCF) Attribute Matrix.
III. Costing the stellarator
The remainder of this dispatch uses 1costingFE, the bottom-up costing framework built in-house to assess each of the six corridors on a common basis. Where Whyte’s criterion takes areal cost as an input and asks whether it is viable, 1costingFE works bottom-up: it takes a machine — major radius, minor radius, field strength, radial build, operating point — and derives the cost of every account beneath it, from conductor ampere-meters and blanket volume up through buildings, indirect costs and financing.[1]
Bottom-up costing puts a stellarator LCOE well above a tokamak, and the difference is mainly attributed to magnet cost assumptions. At 1 GWe the stellarator’s reactor plant comes to ~$9.8B against the compact tokamak’s $4.3B. Of that ~$5.5B difference, the confinement magnets contribute more than the whole delta. Ignoring magnets and the coil-driven installation labor they carry, the stellarator is ~30% cheaper than the equivalent tokamak on its lower heating and BoP costs.[3]
How the magnet account is built, and where the assumptions enter. Conductor quantity is derived from Biot-Savart: producing a field B on axis at major radius R requires a fixed number of ampere-turns, and each turn has to travel around the plasma cross-section, so total ampere-meters scale as G·B·R·r_coil, with G a geometry factor for the coil topology. That quantity is priced at $50 per kA·m for REBCO tape, then multiplied by a markup covering everything the bare conductor is not: winding, casing, structural support, quench protection, cryostat and testing.[2] Two key drivers of magnet cost are the compounding markup factors below:
the geometry factor carries a path multiplier of 2.0 for a stellarator against 1.0 for a tokamak, encoding the assumption that a non-planar modular winding travels roughly twice as far per unit of enclosed flux;
then a manufacturing markup of 1.9× is applied in addition to the geometry factor, on the reasoning that millimeter-tolerance three-dimensional coils are harder to wind, case and support. This markup comes from a U.S. Government Accountability Office report on the NCSX stellarator, which reported a projected 91% cost increase and 4.5-year delay — on the project as a whole rather than the coil account, and never realized, since NCSX was cancelled in 2008 before its modular coils were finished.[15]
Together, those two constants account for close to a factor of four in the magnet cost for stellarators as compared with tokamaks, and they come with significant uncertainty. The remaining magnet cost difference is geometric, and unlike the markup factors it is not an assumption: stellarators run at higher aspect ratio by nature — near 4.5, where a tokamak runs 3 — and plasma volume falls with the square of aspect ratio. Our 1 GWe stellarator therefore needs a major radius of about 9.6 m whereas an equivalent tokamak (assuming an elongation of 1.85) would need ~6.0 m. The published designs show the same spread: ARIES-CS sits near 8 m where the ARIES tokamaks sit just above 5 m major radius for the same net output.
1costingFE’s stellarator coil cost markup is likely conservative. Thea Energy combines conventional planar TF coils with standardized, individually controlled shaping coils to recreate stellarator fields without bespoke 3D magnets. The coil markup therefore prices one route to a stellarator rather than the configuration itself, which makes the magnet account both the largest number in this section and the least secure. The sensitivity analysis that follows measures what that exposure is actually worth against every other assumption in the plant.
IV. The evidence ladder
We have organized our costing optimism into discrete tiers, as defined below. Tiers are cumulative — each carries every entry below it. Tier 0 represents the NOAK design basis, as captured in 1costingFE. Tier 1 represents the best-case values demonstrated to date. Tier 2 captures extrapolated values with a known mechanism for implementation. Lastly, Tier 3 is the speculative tier with no known mechanisms of attainment at this time.[13]
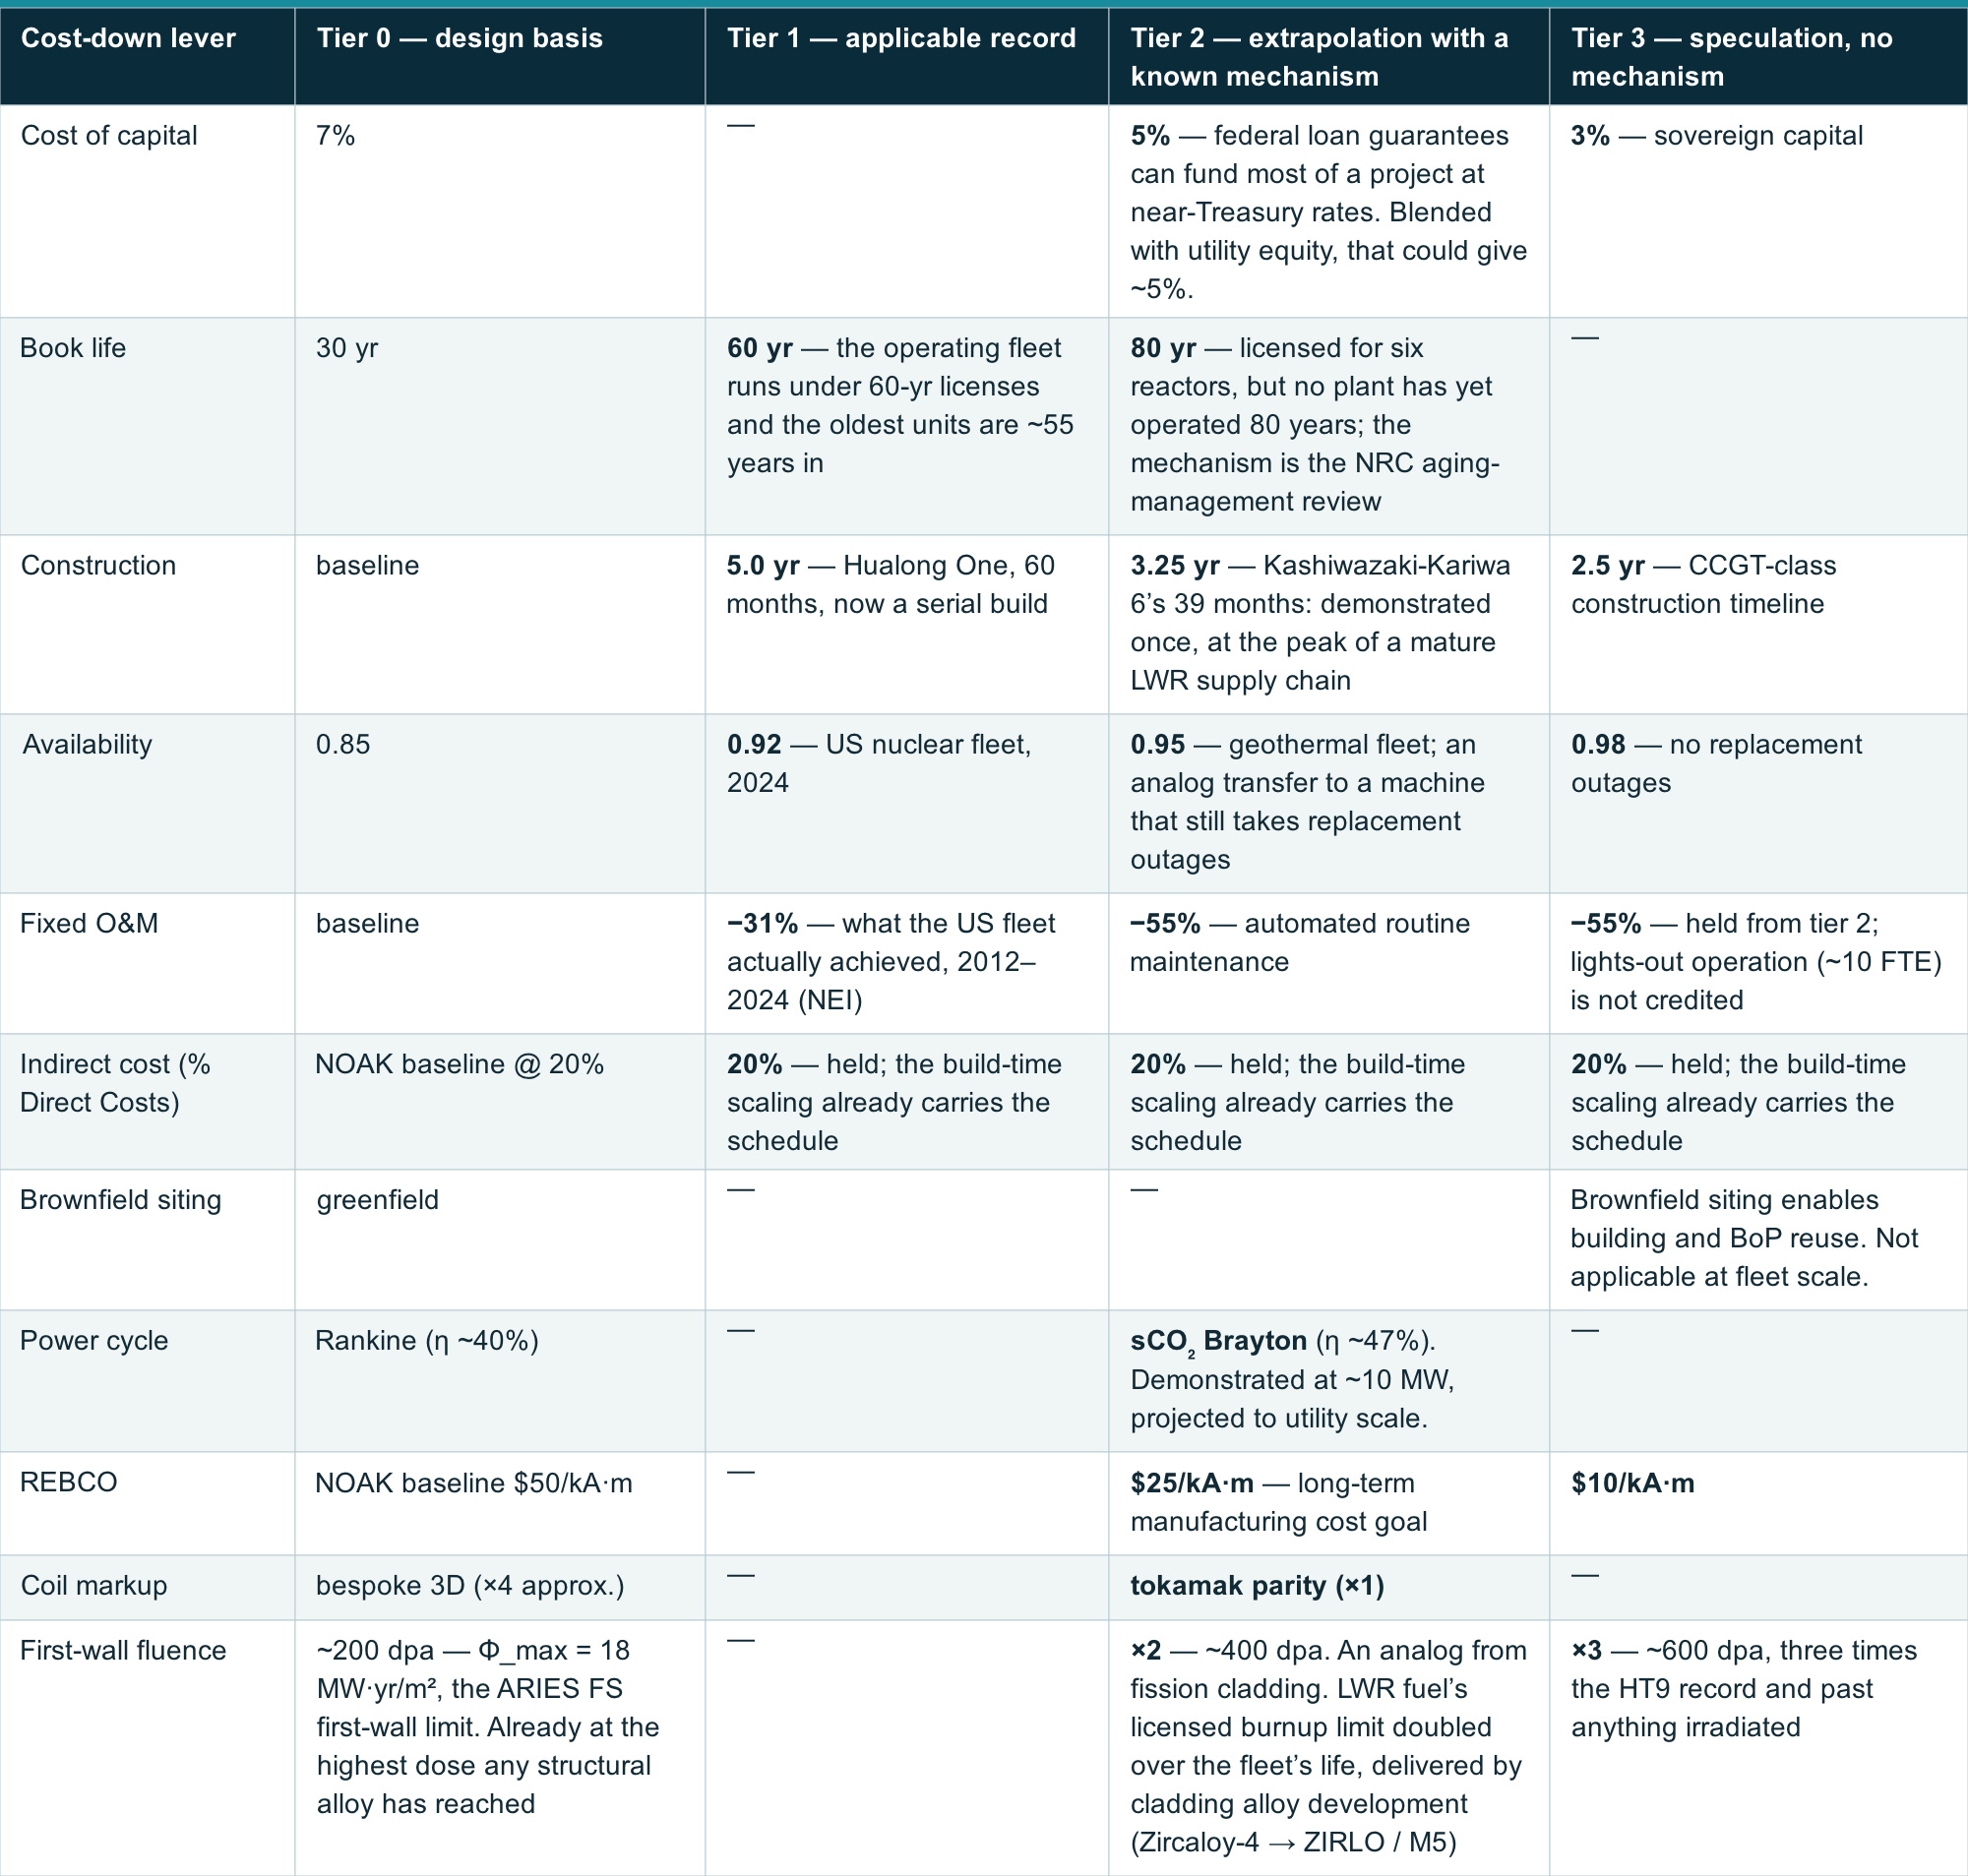
View the full table on 1cf.energy.
The 1 GWe and 3 GWe stellarator LCOEs are assessed at each evidence tier, with the results summarized below. In these scenarios, tier 1 remains above $140/MWh. The tier-2 package reaches about $44/MWh at 1 GWe, conditional on the listed improvements occurring together.
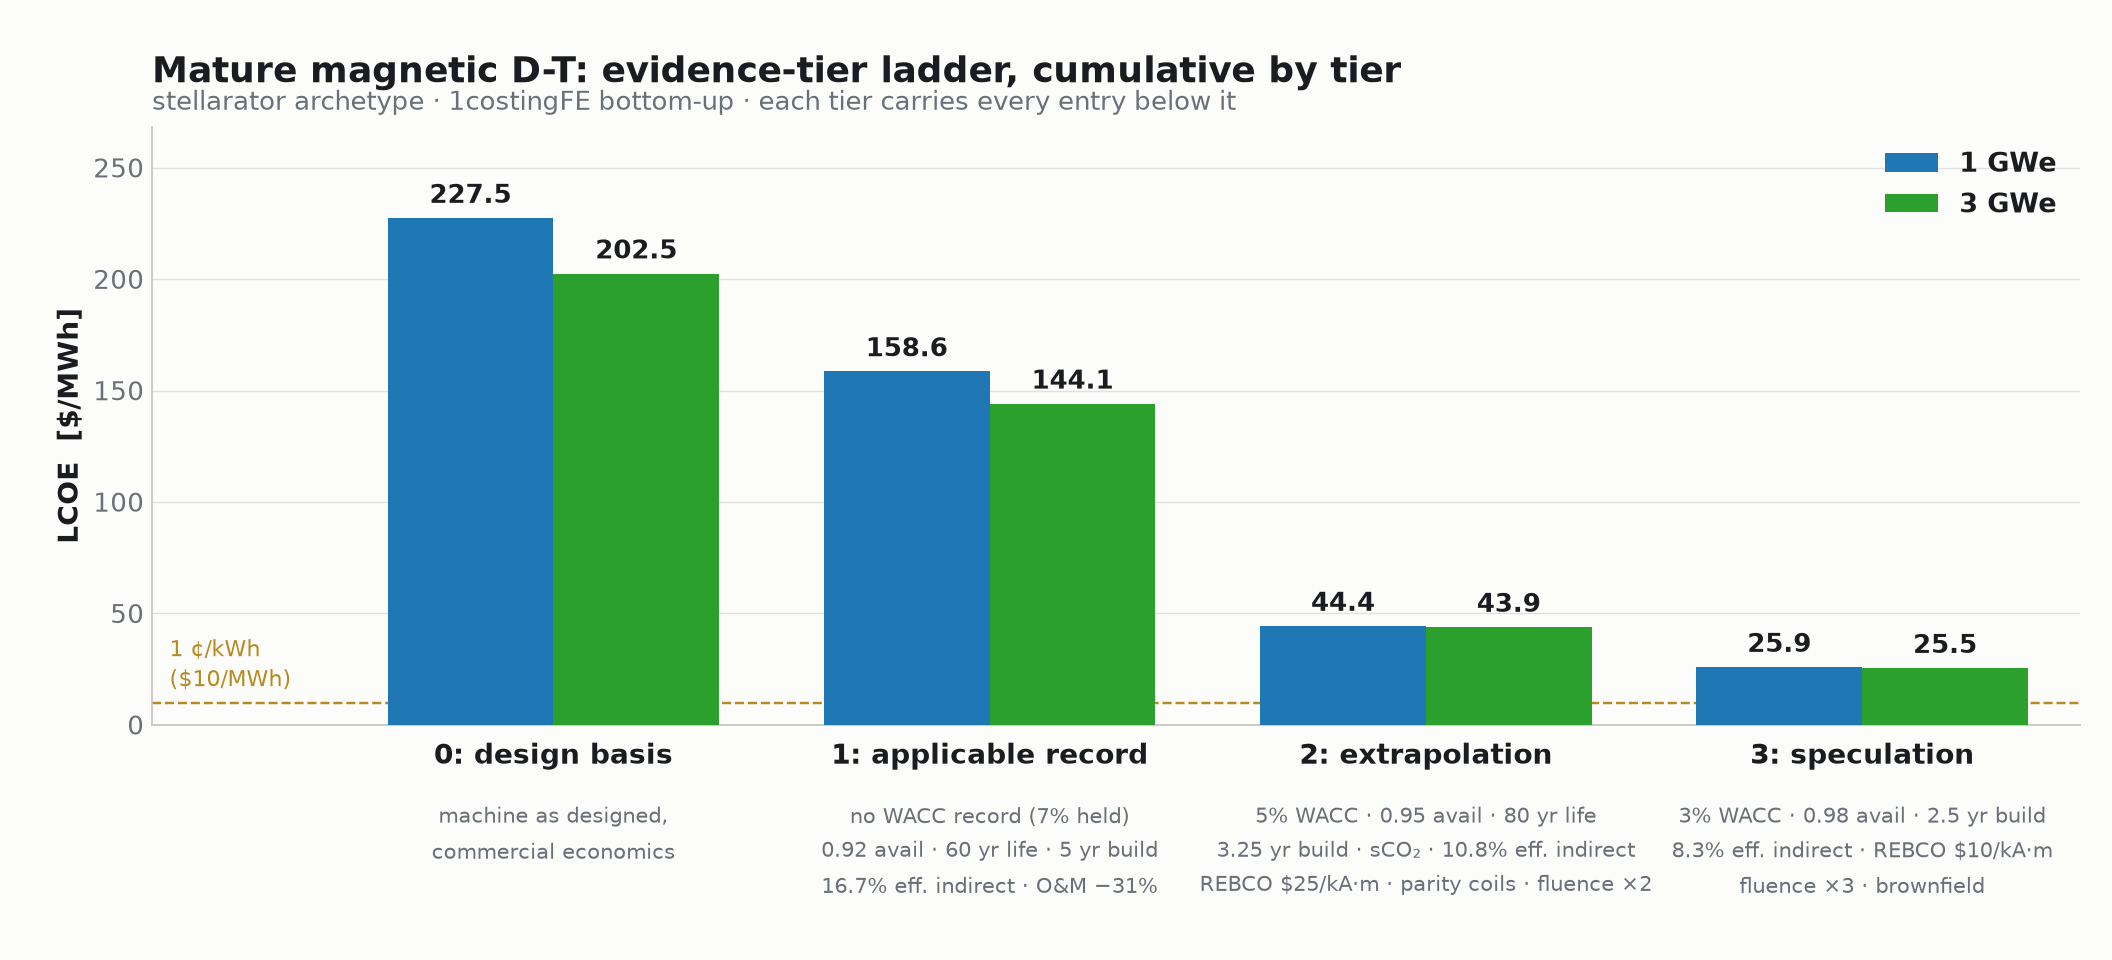
Figure 3. Evidence-tier ladder, cumulative by tier.
V. What moves the cost
The key cost-reduction levers are summarized in the plot below. Their isolated effects on LCOE are ranked by importance. Two features are worth comment.
Assumed magnet cost, from the raw price of REBCO to the manufacturing markup on finished stellarator coils, dominates the equation. Magnets are 62% of this machine’s direct cost against ~20% of a tokamak’s, so the same conductor-price drop is worth 43% of LCOE here and 13% there. Setting the coil markup to its tokamak-parity value outweighs a doubling of the fluence limit, thirteen points of availability, and fifty years of book life combined.[2]
The fluence limit has asymmetric sensitivities. Improving on the 200 dpa design basis pays little: tier 3, which multiplies the baseline fluence limit by 3× (past anything ever irradiated), returns $9.9/MWh of LCOE savings. The downside is not symmetric: cutting the fluence limit by 3×, to ~67 dpa, costs $55.4/MWh, including increased replacement costs and plant downtime and assuming a two-month replacement time. A better wall barely moves the floor; a worse one moves it a long way.[5]
These results can be replicated from the analysis repository, which carries the sizing, ladder and sensitivity code together with the exact 1costingFE commit they were produced against.[14] We welcome correspondence on our modeling assumptions and methodology at 1cf.energy/contact.
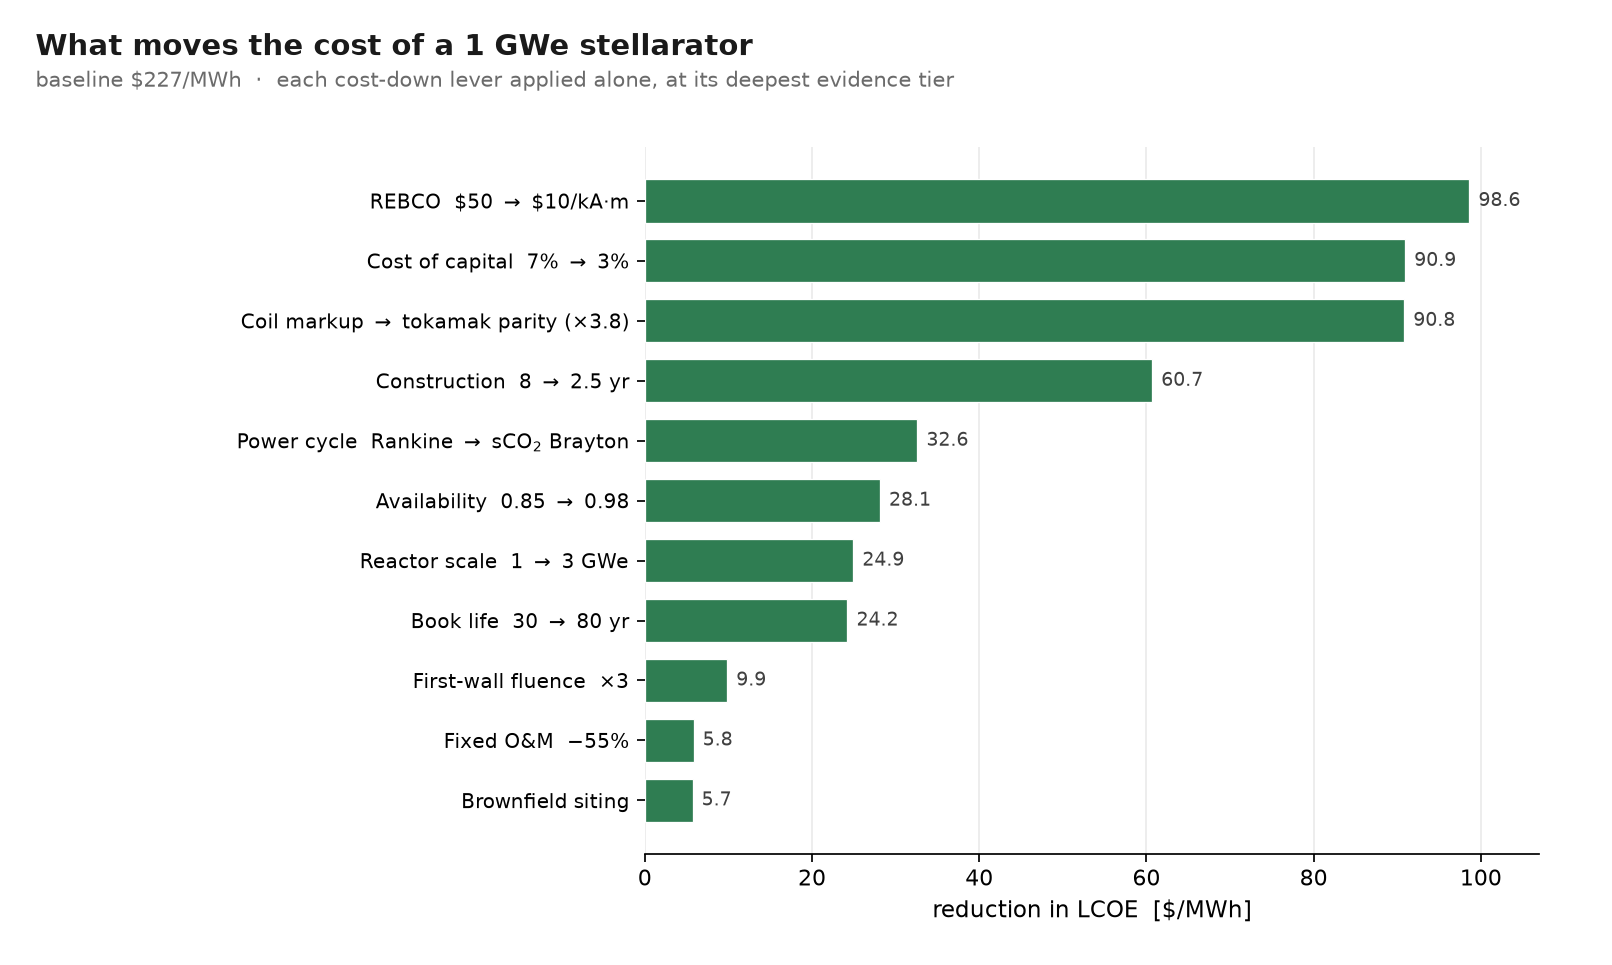
Figure 4. What moves the cost of a 1 GWe stellarator.
VI. Conclusion
The mature magnetic corridor asks the least of physics and the most of engineering economics. Its cost floor is ~2.6 ¢/kWh, reached only at the speculation tier. The descent from $227.5 to $25.95/MWh is carried by financing, schedule, and the magnet account rather than by confinement. The architecture debate that divides the field resolves into a modeling question: Brown’s configuration lens and Whyte’s areal-economics lens both favor the stellarator, while 1costingFE’s bottom-up magnet costing favors tokamaks, due in large part to uncalibrated coil manufacturing markups. Whichever archetype ends up cheapest, the same levers apply to both.
Of the levers a developer actually owns, two stand out: coil manufacturability and the first-wall fluence limit. The field’s effort has gone overwhelmingly into the first, for stellarators especially. Thea Energy is replacing bespoke three-dimensional windings with arrays of standardized planar coils, and Proxima is building its program around computationally optimized buildable magnets. At today’s design point, that focus is correctly aimed: reducing stellarator coil costs to parity with tokamaks is worth more than a doubling of the fluence limit, thirteen points of availability, and fifty years of book life. Our analysis suggests a priority inversion as the coil account approaches its floor, where neutron damage costs — in the form of replacement costs and plant downtime — take a growing share of the remaining LCOE.
Optimizing coil cost alone can only reduce a stellarator’s LCOE by up to ~50%. The rest requires optimistic levers pulled together: record-cheap capital, a long book life, a fast build, high availability, deep cuts to indirects and O&M, high-efficiency power conversion, and a first wall rated well past its design basis. Even with the most speculative plant-wide assumptions applied simultaneously, this corridor does not reach 1 ¢/kWh.
§ Appendix — basis of estimates
[1] Plasma solve
The stellarator is sized by stellarator_sizer.py: ISS04 confinement at renormalization 1.0, density taken as the lower of the Sudo limit (at 0.85 of it, matching the tokamak’s Greenwald fraction), a 5% beta limit, and a neutron wall-load cap; major radius is bisected against the net-electric target and temperature optimized at each step. Inputs are aspect ratio 4.5, B_max 23 T at the conductor, ι = 1.0. The compact tokamak reference solve is different: 1costingFE bisects R₀ and optimizes T_e subject to Troyon β_N ≤ 3.5, f_GW = 0.85, q₉₅ = 3.5, and IPB98(y,2) at H = 1.0. H = 1.0 is deliberate — the corridor’s premise is that no new physics is required, so better-than-scaling confinement is a sensitivity, not a lever.
[2] Magnets
Conductor quantity scales as total kA·m = G·B_center·R₀·r_coil/μ₀, where the geometry factor G = 4π²·f_path carries a coil-path multiplier f_path of 1.0 for a tokamak and 2.0 for a stellarator. That quantity is priced at $50/kA·m for REBCO and multiplied by a separate manufacturing markup — a calibration constant of 3.09 for tokamaks and 5.87 for stellarators. The two are independent and compound: a stellarator carries 2.0 × (5.87/3.09) ≈ 3.8 times the tokamak’s coil cost at equal B, R₀ and coil bore, and the ladder’s “tokamak parity” lever retires both, not the markup alone.
This formulation prices conductor quantity only. It carries no current-density limit and no structural term, and it evaluates ampere-meters at the on-axis rather than the peak field. For a conventional tokamak the formulation is sound, since it recovers the correct total ampere-turns for a TF set. For a spherical tokamak it is not — f_path is 0.80 there, an empirical no-central-solenoid credit rather than a derived path length — and the resulting coil cost should be treated as a lower bound.
[3] Magnet-driven installation
Installation labor (C220111) is 14% of the reactor equipment subtotal, applied identically to both archetypes. Because the stellarator’s coil account is six times the tokamak’s, its installation account is correspondingly larger — $1,150M against $473M — so that share belongs with the magnets in any like-for-like comparison. On that basis the stellarator is ~30% cheaper than the tokamak ex-magnets; against the bare coil account alone it is only 4.5% cheaper.
[4] Auxiliary heating
Per-MW costs calibrated to ITER procurement: NBI $7.46M/MW, ECRH $5.28M/MW, ICRF $4.38M/MW, blending to $5.886M/MW over the reference 20/15/15 MW mix. The aggressive case blends to $2.35M/MW.
[5] First-wall life and wall loading
Core life L = Φ_max/(f_peak · q_n), clipped to [0.5, lifetime × availability], with Φ_max = 18 MW·yr/m² (200 dpa at the model’s stated ARIES FS conversion of 11.1 dpa per MW·yr/m²) and f_peak = 2.0. The peaking factor is required because Φ_max is anchored to the ARIES peak wall loading while the model computes a plant average. The wall-load cap is a peak limit of 4.7 MW/m², enforced by bisection and propagated into the reported forward pass.
Fluence enters replacement cost (CAS72) only — it does not feed availability. A wall that lasts three times longer buys no additional uptime in this model, which is why the fluence lever ranks below financing, magnets and schedule on the sensitivity chart. The downside figure quoted in §V is therefore an overlay on the model rather than model output: it applies av = coreL / (coreL/av₀ + T_out) with a two-month outage, and is measured against the published baseline.
[6] Disruptions
Zero for the stellarator: the disruption rate is identically 0, which is the configuration’s defining operational advantage and the reason the disruption lever is inert here. The compact tokamak reference carries 0.17 events per full-power year, each costing 1% of component life and 72 hours of downtime.
[7] Operations
$54.9M/yr at 1 GWe for D-T, scaling as (P/1 GWe)^0.5 on the INL staffing economy-of-scale exponent, levelized at 2% escalation.
[8] Owner’s and supplementary costs
Owner’s cost $41.2M at 1 GWe (P^0.5); startup tritium inventory $40M; decommissioning provision $272M; spares 3% of CAS23–28; shipping 1.5% and taxes 1% of CAS20; builder’s-risk insurance 1.5% of (CAS20 + CAS30).
[9] Indirect and financing
Indirect service costs are 20% of CAS20 scaled by construction time against a six-year reference — so the indirect fraction and the build duration are not independent levers. At the tier-3 build of 2.5 years the effective indirect is 8.3% of CAS20 at the nominal 20% fraction. Earlier versions of this study also stepped the nominal fraction down the ladder (20/16/12/8%), which charged the schedule twice and is why the deep rungs read lower than the aneutronic studies on the same account. The nominal fraction is now held at 20% on every rung, matching the direct-conversion and p-B11 studies, which both hold EPCM indirects at 20% of direct cost and let the build time carry the schedule, so the effective fraction moves only with the build time. On this study’s ladder of 8 / 5 / 3.25 / 2.5 years that is 26.7 / 16.7 / 10.8 / 8.3% of CAS20. The tier-0 figure is the stellarator’s own as-designed build and so differs between corridors; from the records rung down, where the build is graded against the same fission and CCGT records, all five corridors carry the same effective fraction. Interest during construction uses the uniform-spend form f_IDC = ((1+i)^T − 1)/(iT) − 1. Interest rates are nominal, discounting a 2%-escalating cost stream.
[10] Power cycle
Selecting the sCO₂ Brayton preset moves three coefficients together, not one: η_th 0.40 → 0.47, turbine capex −21.6% per MW, and heat rejection −35.6% per MW. The cycle must be chosen by passing the PowerCycle preset rather than overriding eta_th, because the turbine and heat-rejection coefficients are injected from the preset. Both cases are evaluated at fixed geometry by bisecting requested net output until back-solved fusion power matches the baseline, since the bundled 0D physics model is unavailable in this release and a naive fixed-geometry call silently reduces the plasma.
[11] Model coverage
The cost model represents areal power density and, through recirculating power, current-drive burden. It does not represent radial-build headroom, coil manufacturability, divertor maturity, maintenance access, part count, physics validation, or the effect of first-wall life on availability. It contains no tritium-breeding calculation of any kind, and the omission of an inboard breeding blanket registers as a cost saving rather than a liability.
[12] What is excluded by construction
No byproduct or co-product revenue, no direct energy conversion, no non-D-T fuel, no pulsed operation, and no learning-rate credit from bench-scale whole-device iteration.
[13] How the ladder is built
Tiers are cumulative — each carries every entry below it. Only the levers in the cost-down table are applied; the CAS22 and CAS50 account re-pricings that earlier versions of this model carried (first wall, shield, vessel, remote handling, insurance, decommissioning) have been retired, because they had no evidence grade attached. The sensitivity chart applies the same levers one at a time from the tier-0 basis to the deepest value the ladder reaches, so its bars do not sum to the ladder’s descent.
[14] Reproducing this
The analysis code is at github.com/1cFE/Magnetic_DT_Corridor. It runs against 1costingFE at commit 4c7f0df plus costingfe-mature-corridor.patch, which vendors the model changes these numbers depend on — chiefly the neutron-wall-load peaking factor of [5], without which the first-wall life model cannot be reproduced. A clean clone plus that patch returns the ladder to the cent.
build_stel_anchors.py writes the two-anchor stellarator dataset and build_ct_corridor.py the compact-tokamak reference sweep. ct_tornado.py carries the reduced cost model and the lever definitions, and reproduces the full 1costingFE LCOE at baseline. corridor_tiers.py computes the evidence ladder; tier_ladder_figs.py draws the ladder chart and stel_tornado_plot.py the sensitivity chart.
[15] Sources
T. G. Brown, Three confinement systems — Spherical Tokamak, Standard Tokamak and Stellarator: A comparison of key component cost elements, PPPL. — D. G. Whyte, A. Lo, R. Bielajew, M. Hancock, R. Moeykens and G. Shaw, Criteria for the economic viability of fusion power plants, Journal of Fusion Energy (accepted), arXiv:2604.07367v2.
US EIA and American Nuclear Society, 2024 US nuclear fleet capacity factor — availability, tier 1. US NRC license renewal and subsequent license renewal (Turkey Point 3–4, Peach Bottom 2–3, Surry 1–2) — book life. CNNC Hualong One, 60-month construction; TEPCO Kashiwazaki-Kariwa 6 ABWR, 39 months — construction schedule. US EIA, Cost and Performance Characteristics of New Generating Technologies, Annual Energy Outlook (combined-cycle lead time 3 years; nuclear LWR 6 years) — construction, tier 3. Nuclear Energy Institute, Delivering the Nuclear Promise — operating cost reduction. US DOE Geothermal Technologies Office — fleet availability, tiers 2–3. Argonne / Idaho / Oak Ridge National Laboratories, Investigating Benefits and Challenges of Converting Retiring Coal Plants into Nuclear Plants (2022) — brownfield siting.
US Government Accountability Office, Department of Energy: Office of Science Has Kept Majority of Projects within Budget and on Schedule, but Funding and Other Challenges May Grow, GAO-08-641 (June 2008) — stellarator coil manufacturing markup. Korean APR1400 and CNNC Hualong One indirect-cost fractions, via the 1costingFE CAS30 account justification — indirect cost, tiers 1–2. US DOE/NETL, Quality Guidelines for Energy System Studies, EPCM basis — indirect cost, tier 3 only.
Y. Zhao, Y. Wu, A. Goyal, H. Huhtinen, P. Paturi and Y. Tsuchiya, Commercial compact fusion triggered REBCO tape industry: pulsed laser deposition technology opportunities and challenges, Superconductivity (2025), doi:10.1016/j.supcon.2025.100188 — near-term target $50/kA·m, long-term goal $10–20/kA·m against $150–200 today. GTI Energy / Southwest Research Institute / GE Vernova / US DOE-NETL, STEP Demo supercritical CO₂ pilot plant, 10 MWe rated — power cycle.
NRC and NEA documentation on LWR licensed burnup limits and Zr-alloy cladding development (Zircaloy-4 → ZIRLO / M5) — first-wall fluence, tier 2. HT9 irradiation performance in FFTF, ~200 dpa — first-wall fluence, tier 3. 1costingFE fluence_limit_dt = 18 MW·yr/m², stated as the ARIES FS 200 dpa first-wall limit — first-wall design basis.
1cFE Corridor Dispatch · Mature Magnetic D-T · costed on 1costingFE
Originally published at 1cf.energy.