

I. Introduction
Even under 1costingFE’s optimistic, mature-industry assumptions, a D‑T tokamak’s levelized cost of electricity (LCOE) lands near 11 ¢/kWh. A first-of-a-kind plant would run far higher. A central thought exercise of 1cFE poses the question: what would need to be true for fusion to make electricity cheap enough to transform energy markets? One answer is to sell something other than electrons. This post examines how much coproduct revenue could reduce the electricity price needed to cover plant costs.
Here, byproduct-credit LCOE means modeled costs minus coproduct revenue, divided by electricity sold to the grid. A negative result means the assumed coproduct revenue exceeds the modeled costs. It does not mean electricity has a negative production cost.
We only consider large external markets that offer durable, long-term revenue. Revenue streams that pass the following two filters were considered:
The market must not saturate below fleet scale (~10 GWe deployed). This eliminates medical isotopes and neutron imaging along with tritium resale.
The revenue must be contractable over a plant’s life, not a spot novelty.
Three revenue streams survive: industrial heat, gold transmutation, and synthetic fuels. Gold clears the first filter on the demand side only: its market absorbs fleet-scale output, but on today’s Minamata-compliant mercury supply the enriched 198Hg it needs caps new build near 0.8 GWe per year, so it is carried as a bounded offset for a few plants rather than a fleet-scale one, as the gold section shows. Everything is benchmarked against 1costingFE’s 1 GWe D‑T tokamak case. The results below can be replicated from the analysis repository, which carries the ladder and sensitivity code together with the exact 1costingFE commit they were produced against. [9] We welcome correspondence on our modeling assumptions and methodology at 1cf.energy/contact.
The floor: < 1 ¢/kWh
All three revenue streams reach our long-term cost target of 1 ¢/kWh within the parameter space of this study. Heat, gold and synthetic fuel each clear it at the speculative evidence tier, with heat and gold transmutation reaching negative LCOE values.
II. Heat-as-a-service
High-grade heat extracted from the fusion reactor chamber can be monetized through long-term offtake agreements with industrial process heat customers, improving fusion’s overall economic performance. However, there are relatively few opportunities for powerplants to be sited near industrial customers needing more than ~200 MWth. Thus, providing high-grade heat alone is below the minimum viable scale for most fusion powerplants, meaning some form of cogen (heat + electricity) is required. The interactive tool below helps to visualize (1) what plant size is optimal for a given heat-to-power price ratio, and (2) how much extra Net Present Value (NPV) do thermal storage + smart dispatch buy when accounting for capacity markets and arbitrage income potential? Move the sliders; LCOE and NPV update live.
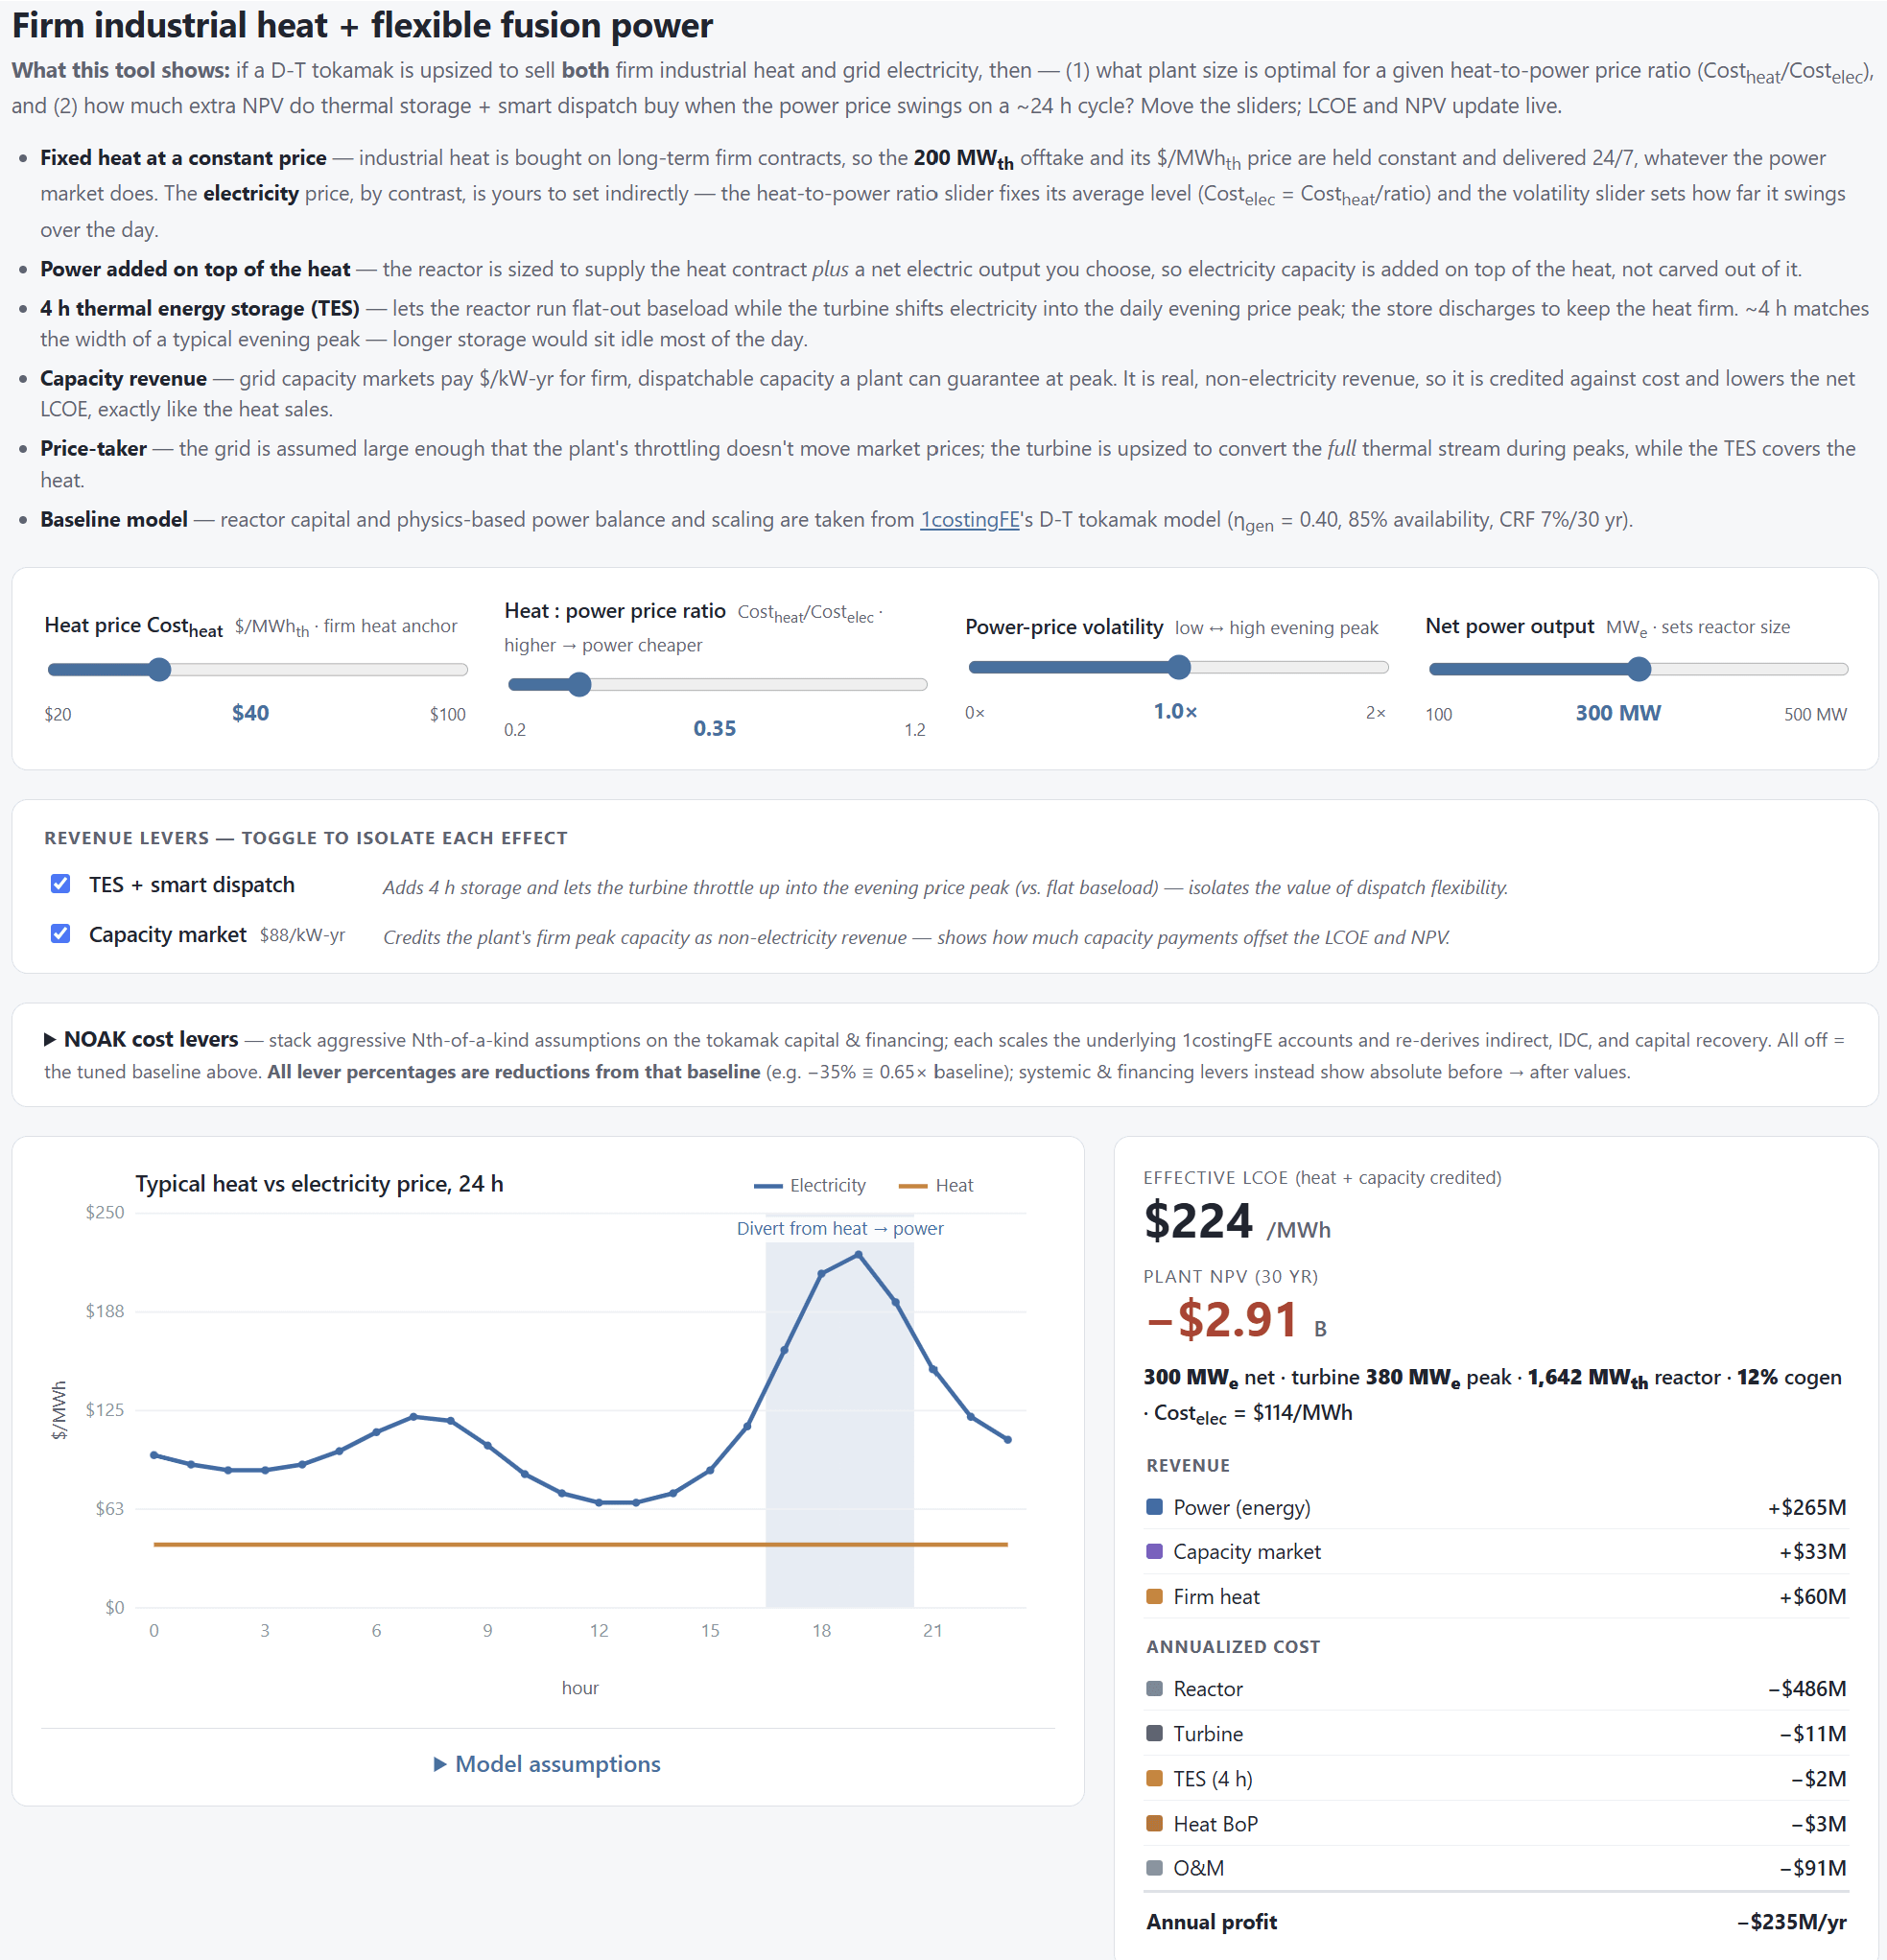
Tool 1. Flexible cogeneration: plant sizing, thermal storage and capacity revenue. · Open the interactive version
Three takeaways
When to add power capacity: heat lowers LCOE only when Cost_heat > Cost_elec × η_gen. Beyond that, adding net electricity pays whenever Cost_elec + capacity credit > the marginal cost of the added power — and because reactor cost scales sub-linearly, that marginal cost falls as the plant grows. Additionally, onsite thermal energy storage (TES) adds flexibility, such that more heat can be diverted to produce electricity during periods of peak power demand while the TES discharges to provide heat. This unlocks capacity market revenue and, to a lesser extent, arbitrage opportunities.
The path to 1 ¢/kWh is narrow. A cogen plant reaches it only by becoming a heat plant that sells power on the side: ~1 GW-thermal of firm heat at a very optimistic ~$80/MWh-th, plus an aggressive ~$140/kW-yr capacity payment, with electricity as a ~100 MWe byproduct. Very few industrial off-takers need a gigawatt of firm heat, so this scenario is highly optimistic. However, more realistic scenarios still show that high-grade heat can be lucrative at lower offtake prices provided that the cost ratio of heat to power still exceeds the power conversion efficiency. More importantly, thermal storage adds flexibility to throttle up electricity output during high-demand periods, which unlocks capacity market revenue that can be used to offset the LCOE.
III. Gold transmutation
Marathon Fusion has one of the few transmutation revenue streams that doesn’t saturate at fleet scale. Their 2025 “Alchemy” paper proposes using 14 MeV neutrons produced during D‑T fusion to breed gold in the blanket via 198Hg (n,2n) 197Hg, which decays to stable 197Au with a 64.1 h half-life.
Because a neutron multiplier is needed for tritium breeding anyway, gold is additive — it doesn’t divert output. Demand for gold is also more scalable than high-grade heat and holds up at GW-scale.
However, the enriched mercury supply chain becomes the bottleneck. Natural mercury is only ~10% 198Hg — meaning that Marathon can only build up to ~800 MWe of capacity per year given the global restrictions on Mercury mining and trading. Marathon outlines a photochemical separation OPEX of ~$2.4/kg Hg-198 and estimates that enrichment-plant CAPEX is negligible at < $1M. There appears to be significant headroom on enriched mercury cost, leaving access to Mercury reserves as the key scaling risk.
A further drawback is that transmuted gold remains too radioactive to be fungible with standard bullion — and therefore unsalable at scale — for roughly fourteen years. Gold routinely changes hands without changing location: LBMA unallocated accounts, ETF shares, and futures positions all transfer ownership while the metal stays in a vault. But what makes those paper claims acceptable is optionality on delivery — participants tolerate not holding the metal precisely because they could demand it. Newly transmuted gold fails that test, so non-possession is no workaround. Revenue simply cannot begin until the material clears. We therefore discount the gold stream to reflect the fourteen-year gap between plant operations and first sale.
Netting these against the base plant, gold takes the 1 GWe tokamak from $110.5 → $89.3/MWh (a −$21/MWh credit) at $100k/kg, 1 t/GW-th/yr, and the 14-year cooldown. The credited gold revenue is $179 M/yr; the added costs are small and exclude the mercury enrichment CAPEX, which are considered by Marathon Fusion to be negligible.
On today’s mercury supply, gold is a real but bounded offset. That −$21/MWh costs 318 t of 198Hg per plant, separated from 3,190 t of natural mercury — about 1.1 years of the world’s entire Minamata-compliant supply for a single machine. Nothing about the mercury market has to change for this case to work, but the arithmetic caps the industry near 0.8 GWe of new build per year. Gold makes a few plants meaningfully cheaper and a fleet not at all.
Buying more gold means buying much more mercury, and the returns saturate. Marathon’s own neutronics have the gold production flattening with blanket thickness: their 415 t Hg-198/GW-th reference design produces about 2 t Au-197/GW-th/yr, which is ~2× the output of the case above for 4.15× the mercury — 1,320 t of 198Hg per plant, drawn from 13,237 t of natural mercury, or 4.7 years of world compliant supply. The credit roughly doubles to −$41/MWh, the single largest in this corridor. But the deployable build rate falls to ~0.18 GWe/yr — about one plant every five years — and the environmental ledger grows with it. The Minamata Convention bans primary mercury mining, so every tonne has to come from by-product recovery, recycling and stockpile drawdown; each plant returns ~11,900 t of 198Hg-depleted mercury to a market that trades a fraction of that annually, or pays roughly $46 M to immobilize it as cinnabar; and export bans in the EU and US constrain where the separation plant can sit relative to the reactor.
The two bookends say the same thing from opposite ends: gold’s economics improve as the mercury ask grows, and its deployability collapses at the same rate. The binding constraint is the mercury supply.
Gold co-product ledger — 1 GWe D‑T tokamak
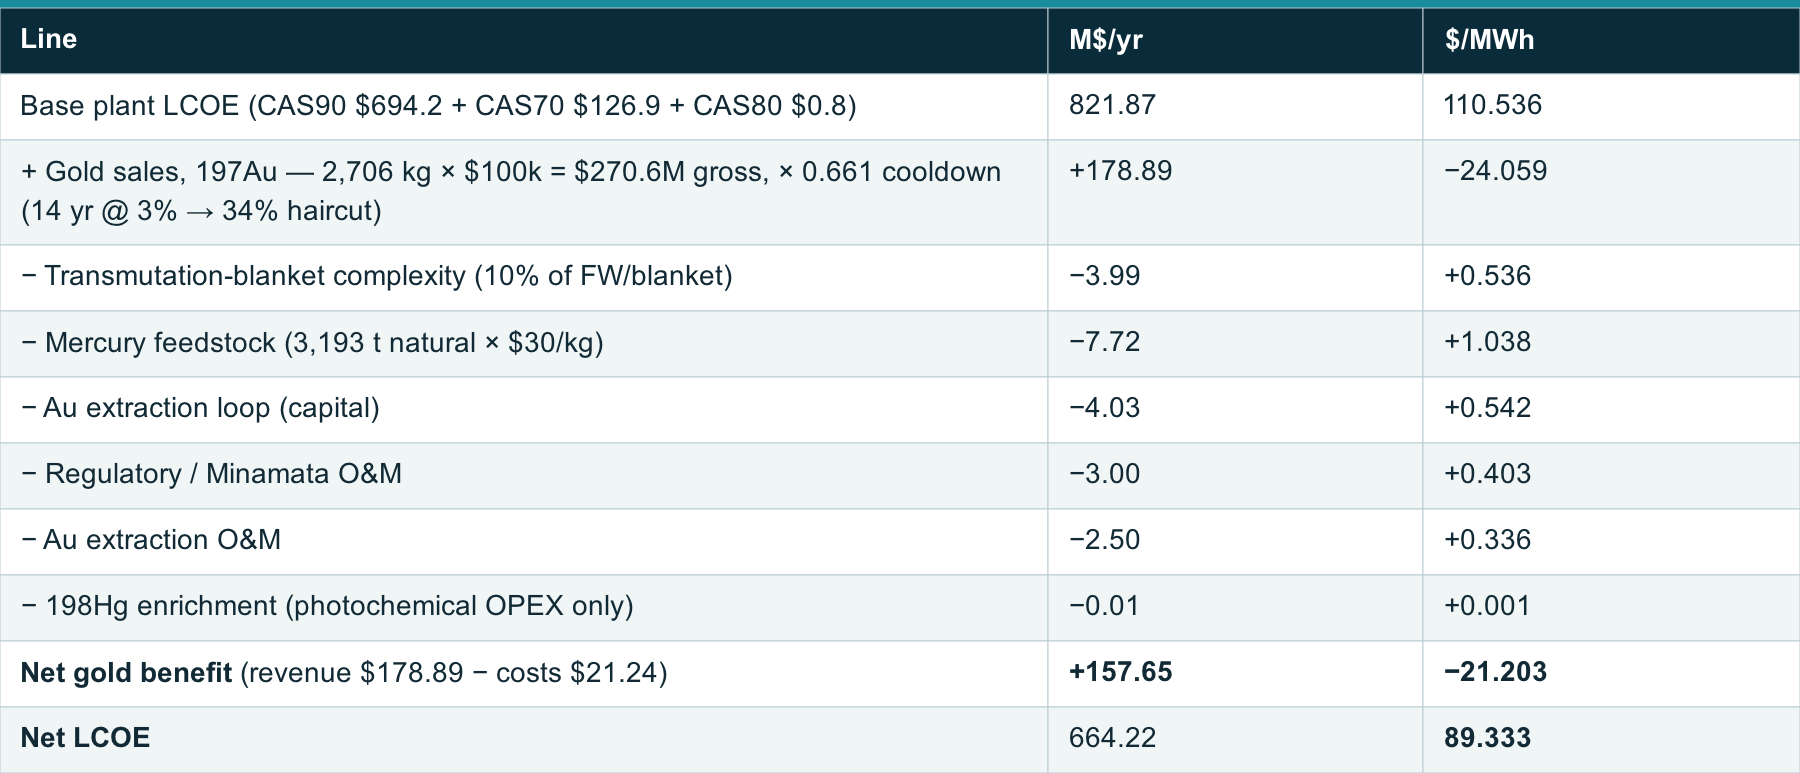
View the full table on 1cf.energy.
Table 1. Byproduct-credit accounting at $100k/kg Au, 1 t/GW-th/yr, 100 t 198Hg/GW-th, 14-year cooldown at 3%, blanket markup 10%. The gold credit is the cooldown-discounted levelized value of 197Au sales rather than a within-year cash flow, so the $/MWh column is the authoritative result and the M$/yr column is shown for traceability of each line; the net annual figure is the base plant cost less the net gold benefit. Enrichment-plant CAPEX is excluded based on Marathon’s own analysis. [6] The blanket-complexity markup is a ~$1/MWh lever end-to-end: 30% → 10% → 0% spans +1.6 → +0.5 → 0 $/MWh.
IV. Synthetic fuel
Synthetic fuels are made from the plant’s own electricity, so they inherit its cost rather than lowering it — cheap synfuel is a consequence of a low LCOE, never a cause of one. What synfuel can do for an already-cheap plant (<~5 ¢/kWh) is trim the effective LCOE at the margin: it consumes energy that would otherwise be curtailed, and it adds revenue once synfuel prices clear the plant’s delivered cost.
The H₂-led tool below illustrates this: the reactor runs flat-out and splits the busbar between the grid and a baseload electrolyzer, making hydrogen whenever power is cheap and diverting to the grid only during price spikes. Dispatch is governed by an H₂ floor price — the grid price above which selling power beats making H₂ — equal to (H₂ price – logistics) × 19 kg/MWh. The headline metric is a byproduct-credit grid LCOE: (reactor + electrolyzer + logistics – H₂ sales) ÷ grid MWh.
The sensitivities are lopsided: a $50/MWh plant delivers hydrogen at ~$4.0/kg (feedstock + electrolyzer + logistics). Below that, H₂ sells at a loss and the effective LCOE increases. If hydrogen were to sell for ~$4.75/kg, the LCOE becomes negative.
Grid volatility mostly helps Net Present Value (NPV), which includes all cost and revenue streams, whereas LCOE excludes electricity-sales revenue by definition. Higher volatility in power markets raises demand peaks which helps NPV, but slightly raises LCOE because of the foregone H₂ sales during that time. Note: transmission- and saturation-driven curtailment aren’t modeled here, and thus on-site synfuel generation may be slightly more valuable in reality.
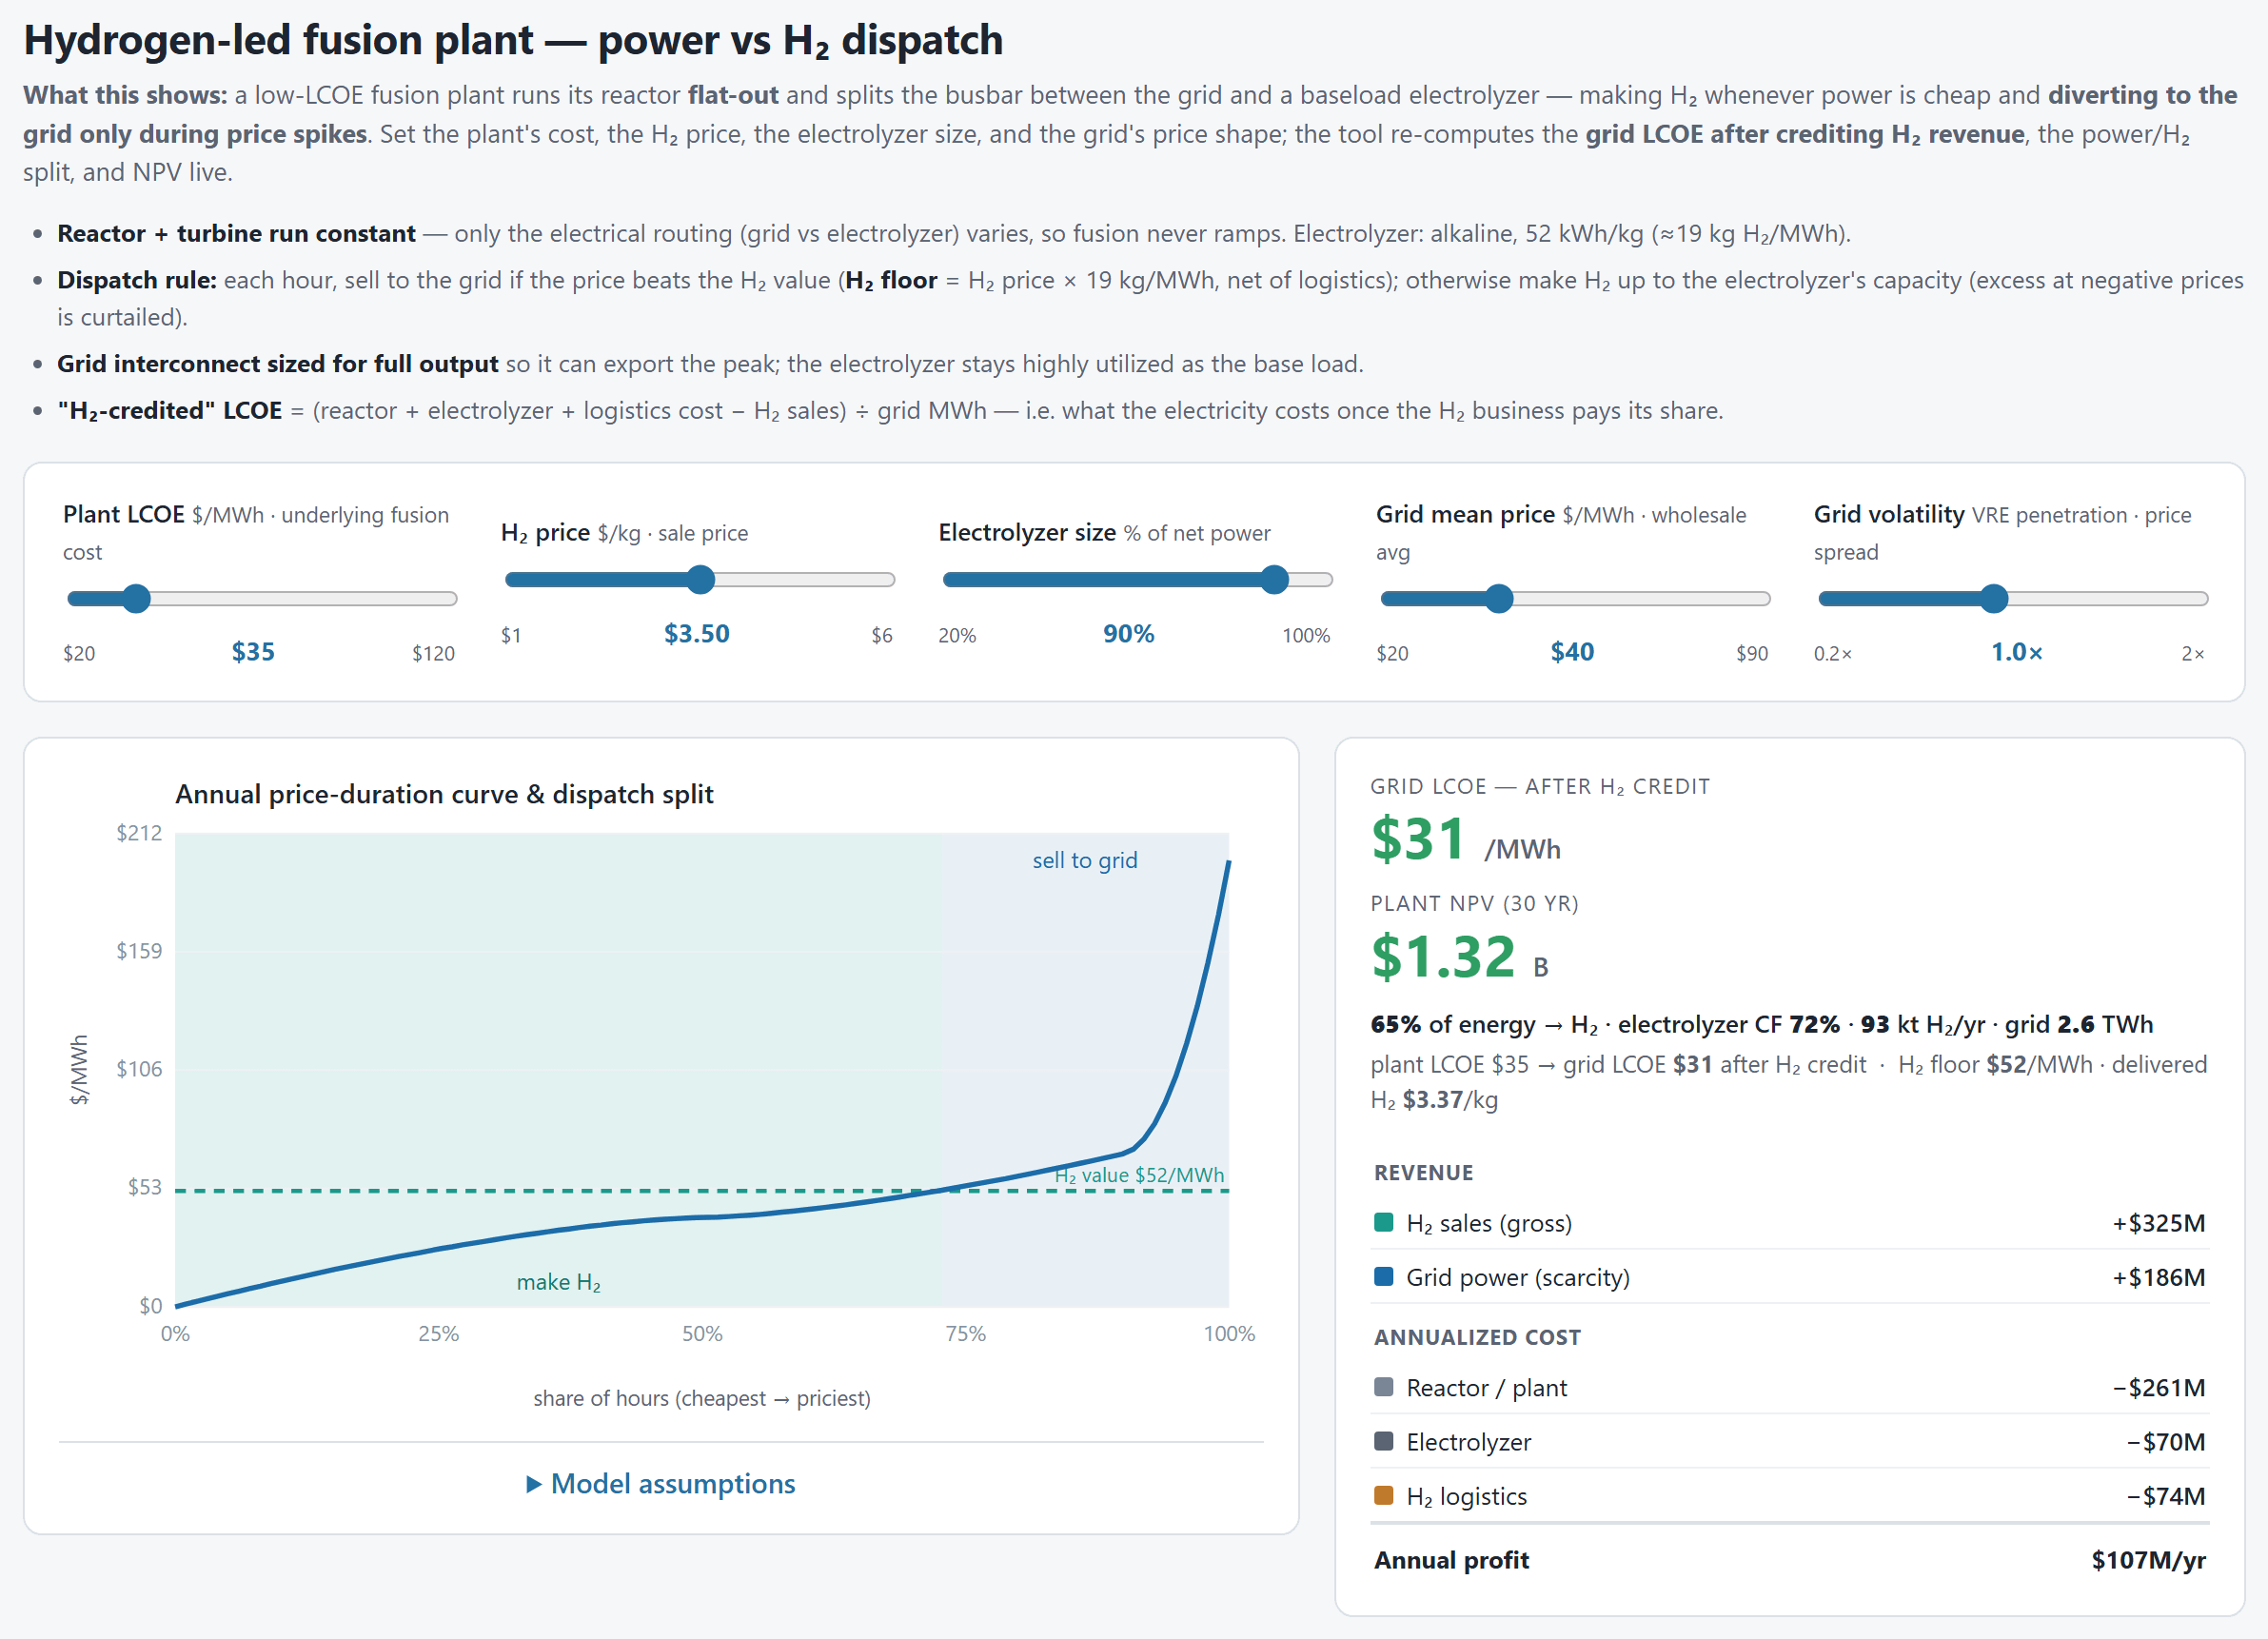
Tool 2. The H₂-led plant: busbar split, floor price and byproduct-credit LCOE. · Open the interactive version
So how does a 5 ¢/kWh plant reach 1 ¢/kWh? Realistically, through the H₂ price alone. Our analysis indicates that, at the assumed electrolyzer size and grid price profile, the fuel price has to clear ~$4.3–4.5/kg (just above the delivered cost) to close the LCOE gap. Since bulk (grey) hydrogen trades at ~$1–2/kg, that ~$4.40/kg price point would require either carbon taxes on grey hydrogen or policy support for clean hydrogen to be competitive in this scenario. Additionally, this path to 1 ¢/kWh assumes a large-scale local H₂ consumer reachable by gaseous pipeline — hydrogen has no deep global spot market to sell into, and pricing in the liquefaction and shipping a distant buyer would need pushes the breakeven well above $4.75/kg.
V. The evidence ladder
The three streams above are each argued at their own most favorable settings. To compare them on one footing, we grade every input by the strength of the evidence behind it, using the same four rungs as the other 1cFE corridors: tier 0 the design basis, tier 1 a value some real project or market has held, tier 2 a labeled step past the records with a stated mechanism, and tier 3 speculation past any evidence base. Tiers are cumulative.
Two adaptations are deliberate. The plant underneath is not pinned — its levers track the mature corridor’s ladder at every rung, so a tier here grades the market evidence for the co-product and the plant evidence beneath it together. And the two diverting streams are matched: heat’s firm offtake and synfuel’s electrolyzer are sized in step at every rung, so neither is credited for giving up more electricity than the other. See the table below for the full assumptions per revenue stream.
Assumptions by evidence tier — 1 GWe D‑T tokamak
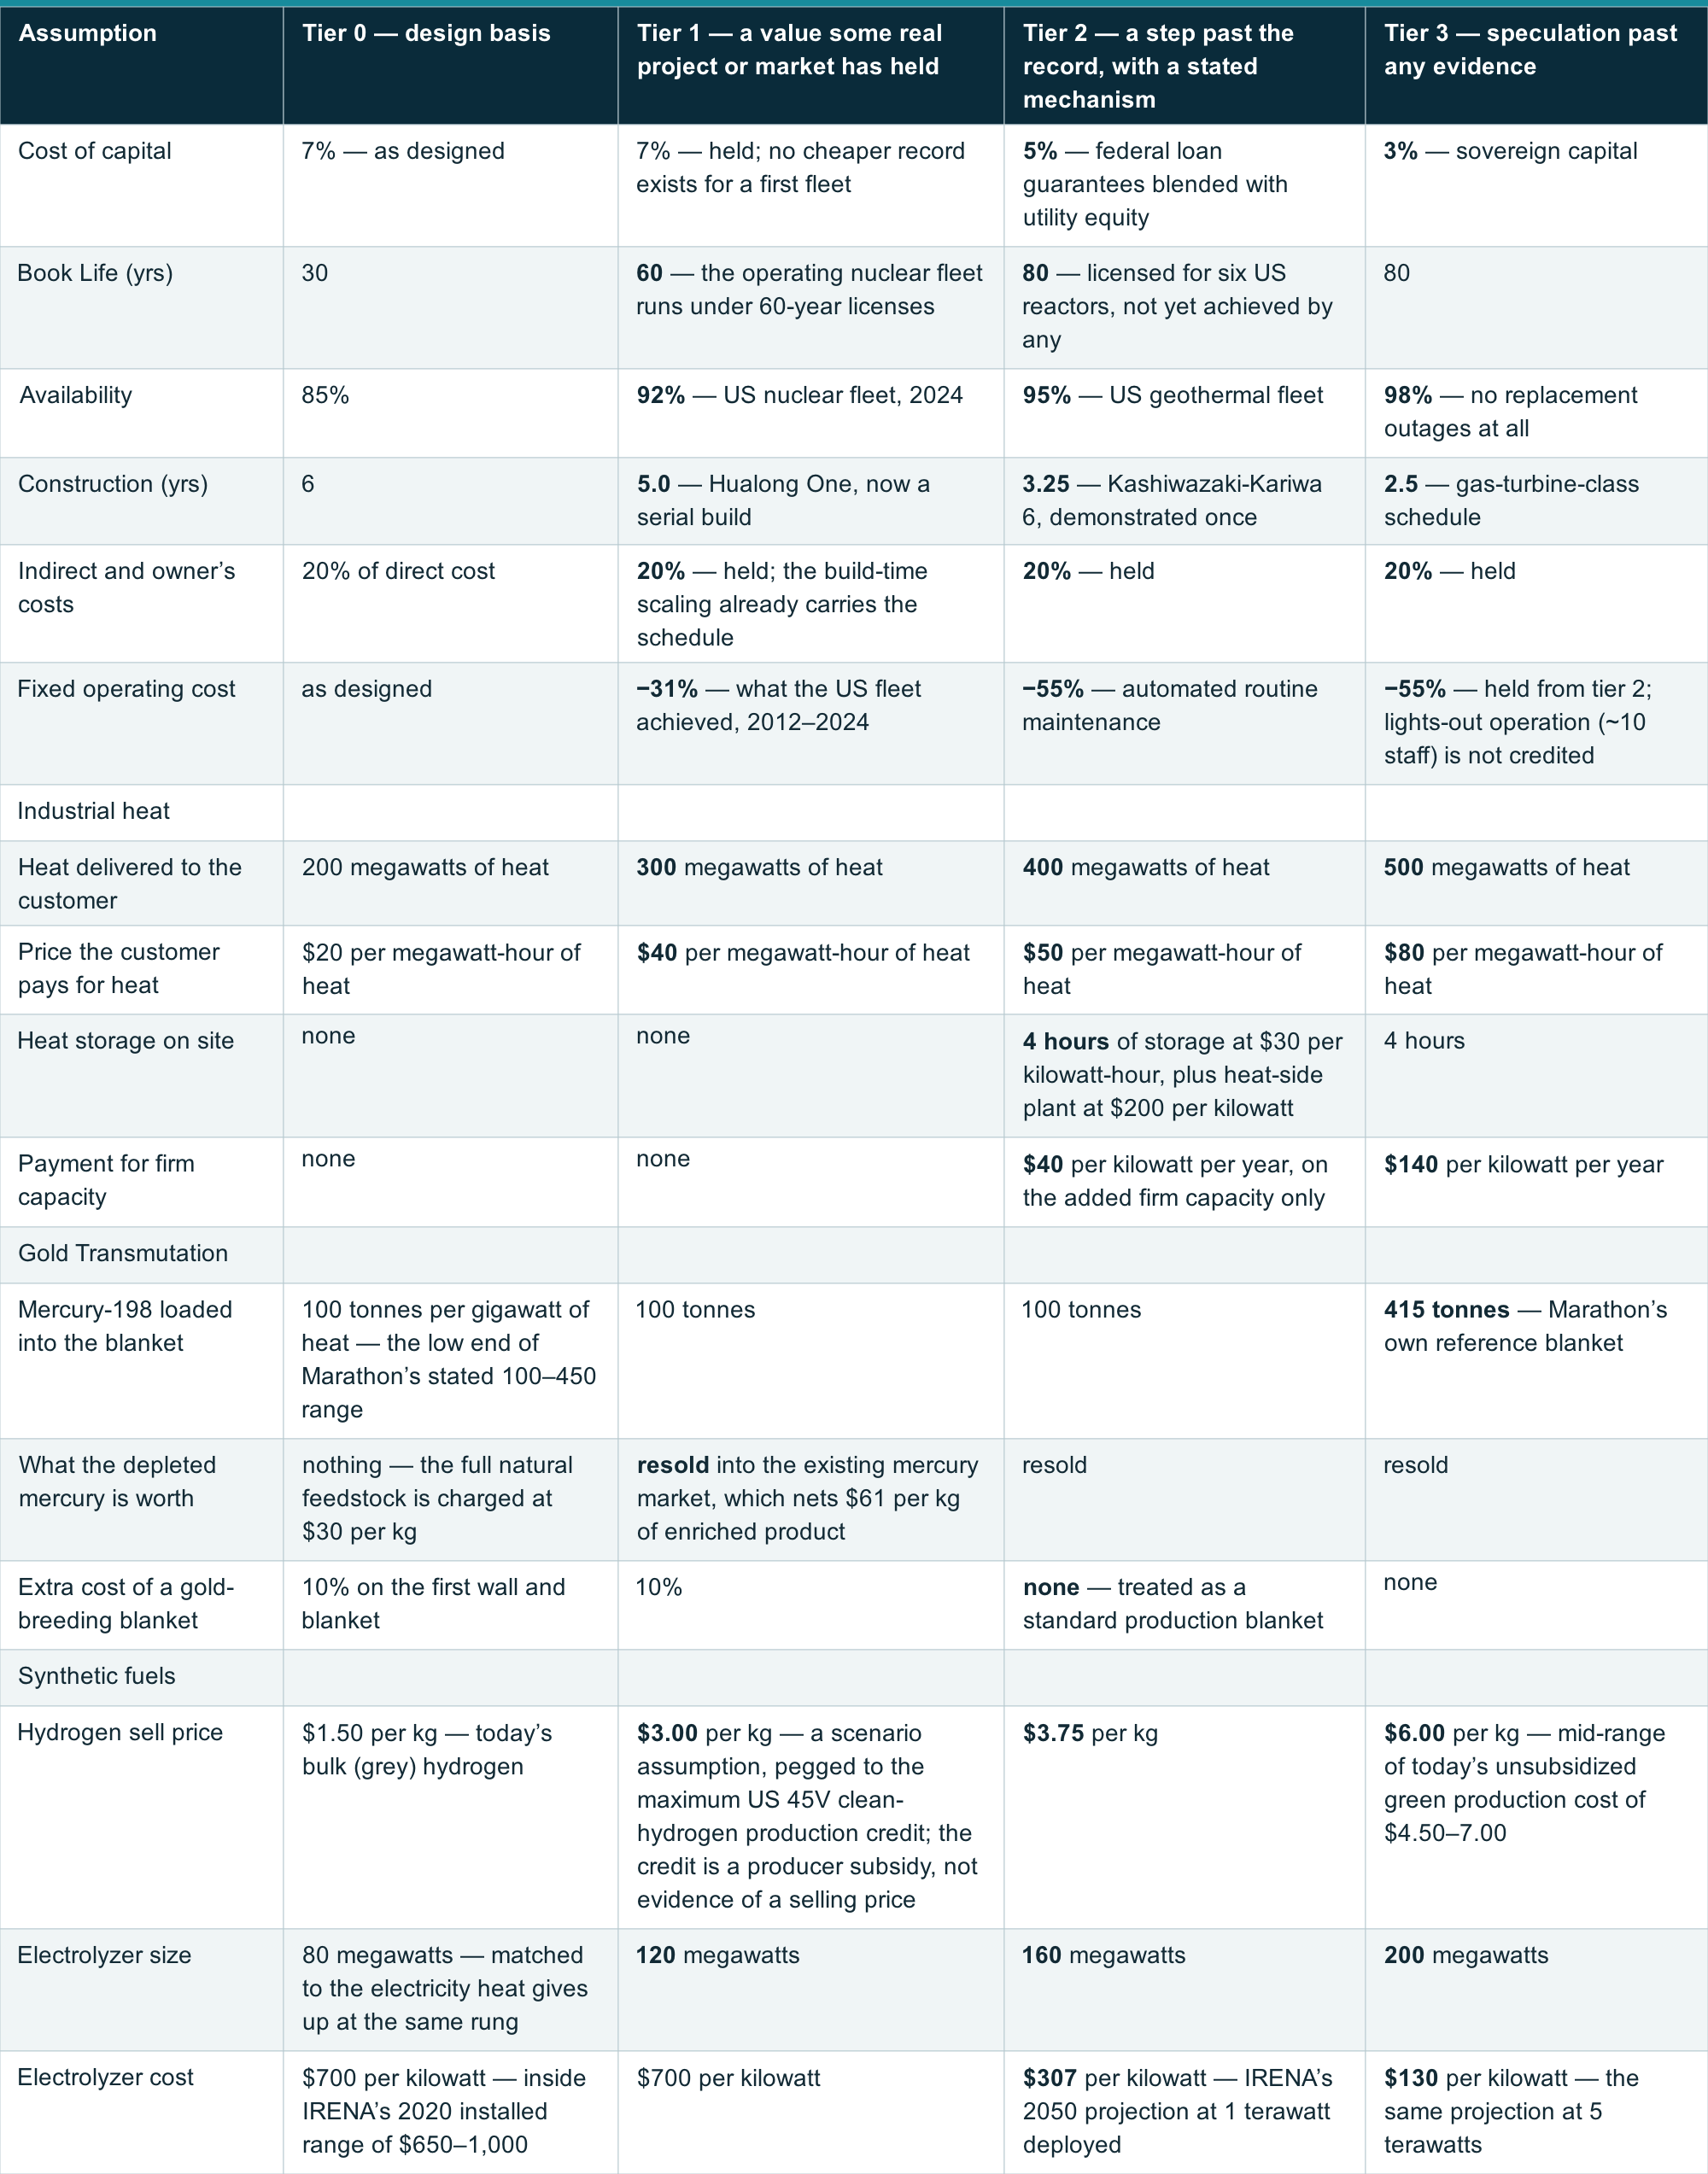
View the full table on 1cf.energy.
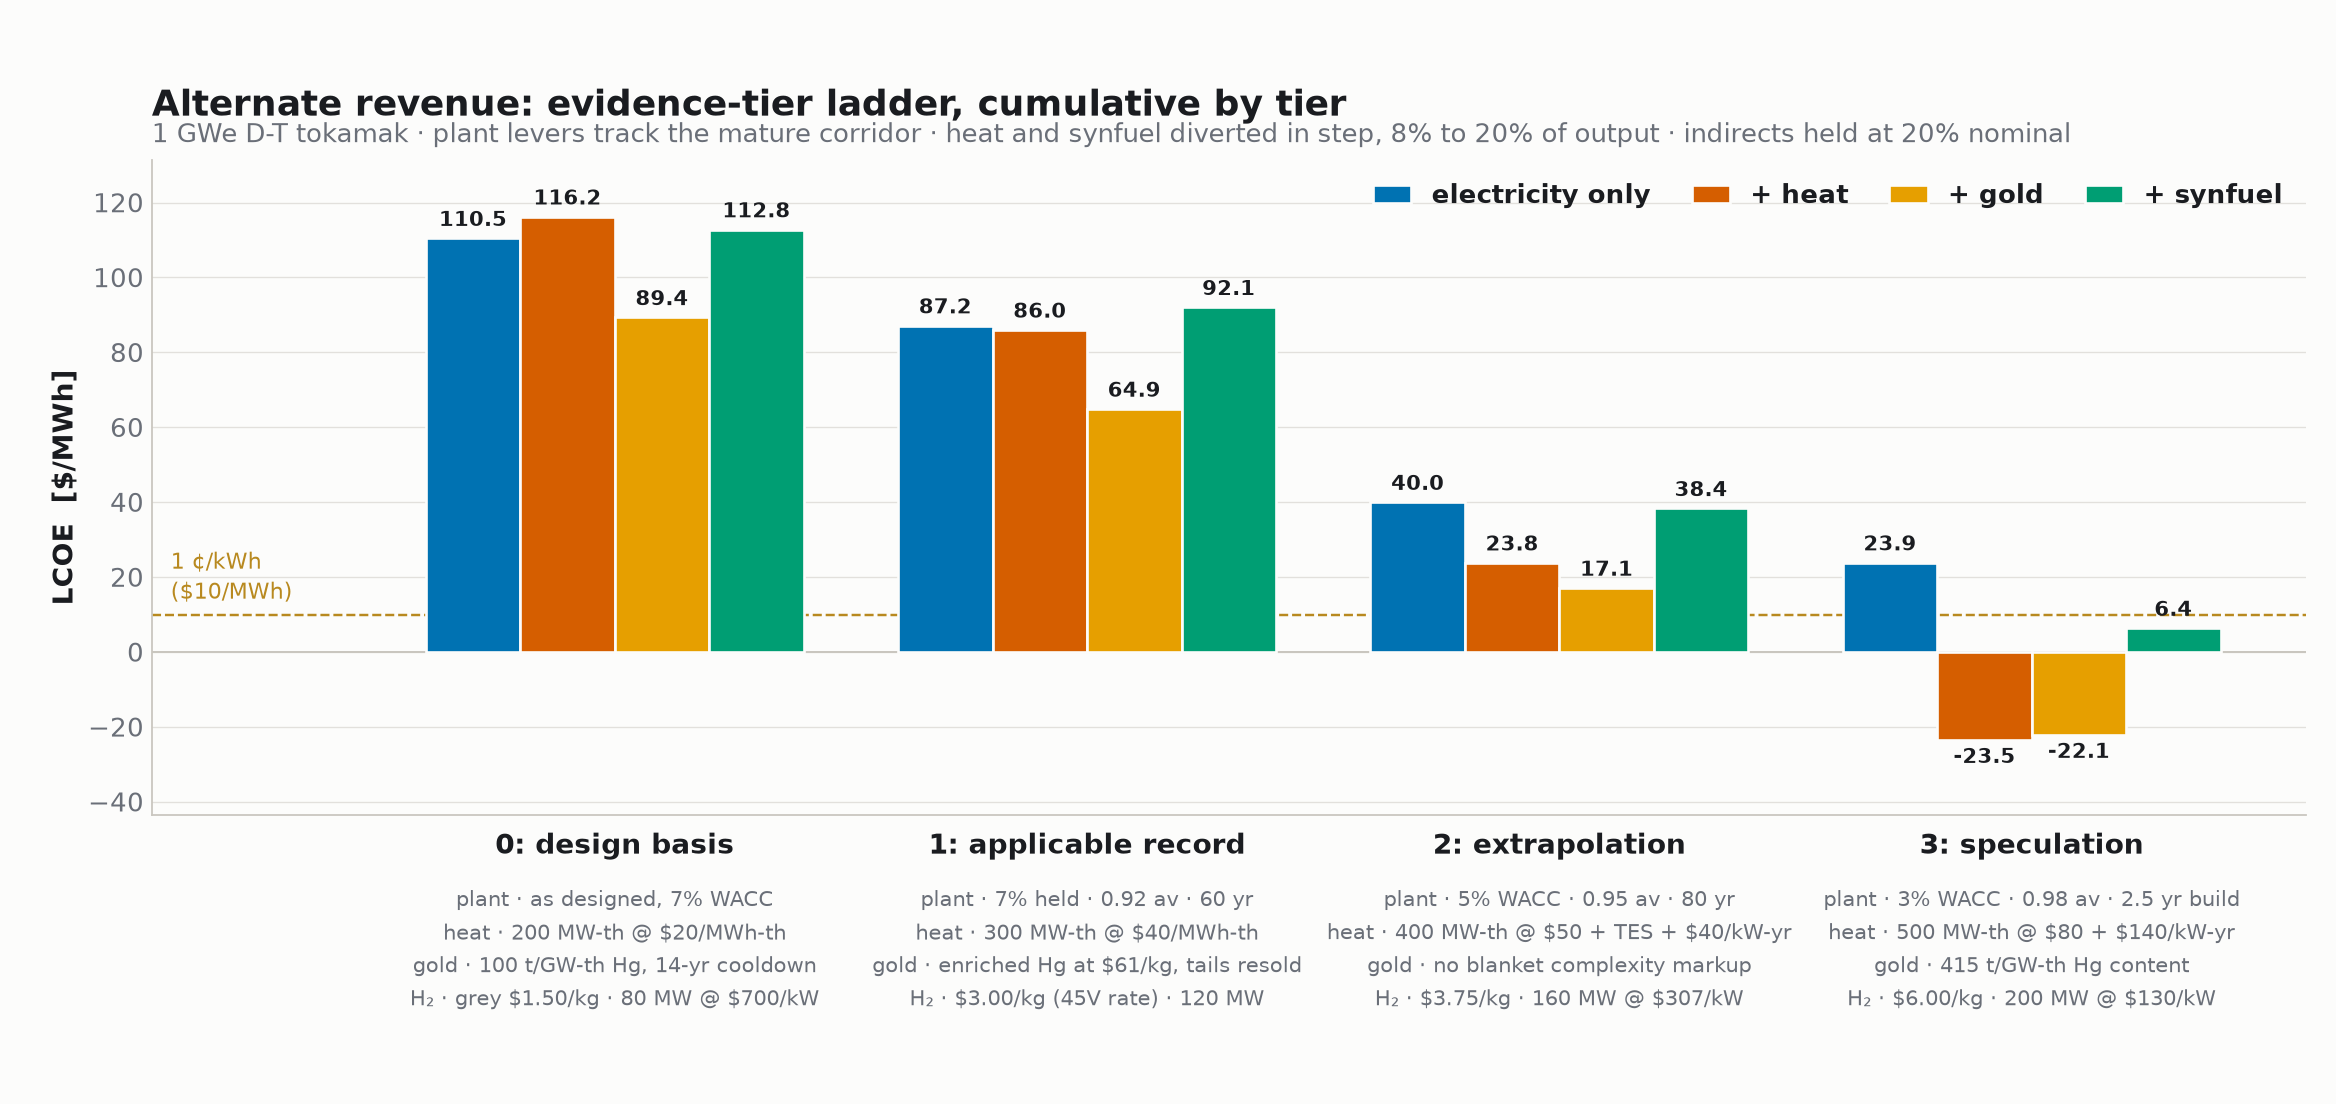
Figure 1. Evidence-tier ladder, cumulative by tier. The coproduct cases show electricity cost after revenue credits. Gold remains constrained by mercury supply, as discussed above.
At the design basis only gold pays, confirming its status as a promising bridge technology. Heat and synfuel both raise the cost of electricity at tier 0, by $5.73 and $2.30/MWh. The plant is simply too expensive for its own heat or hydrogen to be worth diverting: heat clears only when its price beats LCOE_elec × η_gen, and synfuel only when the hydrogen sell price beats its delivered cost. Gold is the exception because it is additive — it takes no output away.
Gold books most of its value before the ladder starts climbing. Its tier 0 credit is already −$21.15/MWh, and the whole ascent from tier 1 to tier 3 adds only another $24.8. That is partly a real property of the stream and partly an artefact of what tier 0 is allowed to grant it: the published basis discounts the fourteen-year deferral at 3% rather than the plant’s own 7% WACC, and excludes the enrichment plant entirely. Heat and synfuel get no equivalent head start.
All three revenue streams clear the 1c/kWh target by tier 3, and none does so alone. The plant’s own levers carry $86.6/MWh of the descent — more than any co-product. Heat adds $47.3 on top, gold $46.0, synfuel $17.5. The honest reading is that these are cost offsets on a plant that has already had to get cheap, not independent routes to 1 ¢/kWh.
VI. What moves each stream
The evidence tiers above were constructed to ask comparable things of each stream: heat and synfuel escalate price fourfold and volume two-and-a-half-fold across the ladder, and the two diverting streams give up matched shares of electricity at every tier. Gold is the one exception, of necessity — its price is already spot, so volume is its only escalating input and that escalation lands entirely at tier 3. The symmetry was imposed on the inputs, but their effects are very unevenly weighted, as seen below.
For scale: making the plant itself cheaper is worth $86.6/MWh across the same four tiers — more than any of these co-products buys alone. For heat and synfuel, price and volume multiply, so raising both together is worth far more than raising either alone. Gold sell price is assumed to be constant, so its levers are nearly additive.
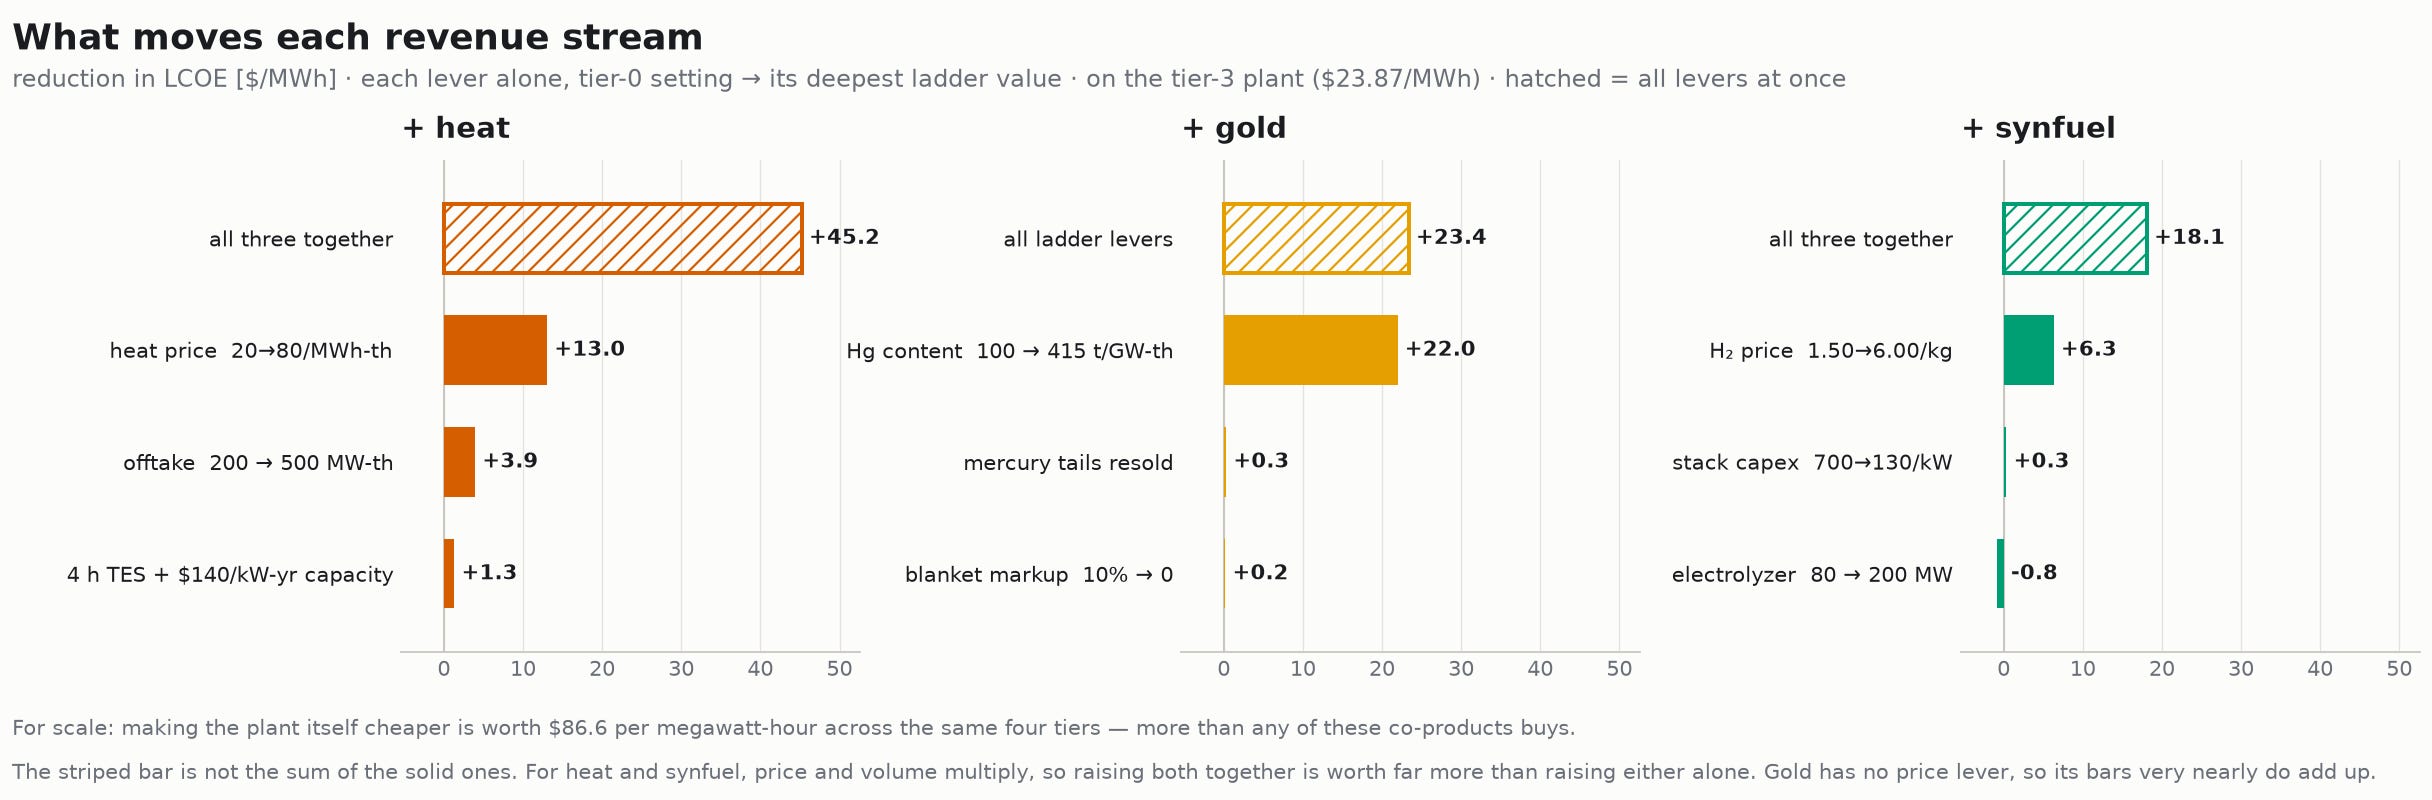
Figure 2. Sensitivity of each revenue stream to its own levers.
Heat is a price story, not a volume story. Taking the offtake from 200 to 500 MW-th is worth $4.0/MWh; taking the price from $20 to $80/MWh-th is worth $13.0. Thermal storage and the capacity payment together add only $1.3 once capacity is credited on the incremental firm MW rather than the whole plant. But the three compound: together they are worth $45.2, far more than the $18.3 they buy separately, because price and volume multiply.
Gold is one lever and two rounding errors. Raising the blanket’s mercury content from 100 to 415 t/GW-th is worth $22.0/MWh of the stream’s $23.4 total. Reselling the depleted mercury tails is worth $0.29 and retiring the blanket complexity markup $0.19. This is structural: gold earns ~$400 M/yr against ~$11 M/yr of costs, so nothing on the cost side can move the answer. Even the enrichment plant is negligible when charged at Marathon’s estimate of $1/W. [6]
Synfuel’s electrolyzer is a liability until the hydrogen price surpasses the delivered LCOH (Levelized Cost of Hydrogen). Growing the electrolyzer from 80 to 200 MW on its own is worth −$0.78/MWh — idle capital. The hydrogen price carries $6.3 of the stream’s $18.1, and the rest is interaction: a bigger stack only pays once there is a price worth running it for.
These results can be replicated from the analysis repository, which carries the ladder and sensitivity code together with the exact 1costingFE commit they were produced against. [9] We welcome correspondence on our modeling assumptions and methodology at 1cf.energy/contact.
VII. Which stream, which reactor?
No single stream is universal; each has a best-case regime:
Heat — any thermal fusion powerplant co-located with a large industrial heat sink, at a high decarbonized heat price, with capacity payments enabled by adding thermal storage. Rare siting, strong where it exists.
Gold — a high-density, high-neutron D‑T machine (tokamak / ARC-class) at $100k/kg gold, deployed as one or a few plants, not a fleet. Supply-capped but potentially the largest single credit.
Synfuel / H₂ — an already-low-LCOE NOAK plant in a volatile grid with a premium hydrogen off-take; a flexibility and curtailment play, not a cost cure.
The headline: at the baseline cost of electricity, adding hydrogen production downstream of a fusion reactor only increases the effective LCOE, although there is some benefit when an onsite electrolyzer mitigates curtailment during periods of grid saturation. The gold transmutation pathway, with optimistic assumptions for Hg‑198 enrichment, has the potential to offset cost significantly, though the build rate of this technology is limited by Mercury mining and trading restrictions. And finally high-grade heat has significant revenue potential depending on the ratio of heat to electricity costs.
§ Appendix — basis of estimates
[1] Base plant.
1costingFE 1 GWe D‑T tokamak: CAS90 $694.2M + CAS70 $126.9M + CAS80 $0.8M = $821.87M/yr, giving $110.54/MWh at availability 0.85, η_gen 0.40, CRF 7%/30 yr.
[2] Plant levers by tier.
Carried unchanged from the mature magnetic D‑T corridor and cumulative: tier 1 holds 7% WACC (no cost-of-capital record exists) with 60 yr book life, 0.92 availability, 5 yr construction and −31% fixed O&M; tier 2 adds 5% WACC, 80 yr life, 0.95 availability, 3.25 yr construction; tier 3 adds 3% WACC, 0.98 availability, 2.5 yr construction. Resulting electricity-only LCOE: $110.50 / $87.16 / $40.02 / $23.87 per MWh.
Indirect and owner’s costs are held at 20% of direct cost on every rung, matching the direct-conversion and p-B11 studies, which hold the same 20% at every rung. All five corridors now hold the same 20% nominal, and because they also grade the build to the same 5 / 3.25 / 2.5 years, they carry the same effective fraction from the records rung down (16.7 / 10.8 / 8.3%). Tier 0 differs between corridors because it is each machine’s own as-designed build — six years here, eight for the stellarator, five for the pulsed and both aneutronic plants. They still fall across the ladder without being graded, because the model charges CAS30 as that fraction scaled by build time ÷ 6 yr: the same 20% nominal is 20% effective at the six-year design basis, 16.7% at five years, 10.8% at 3.25 and 8.3% at 2.5. Grading the nominal fraction as well would have charged the schedule twice.
[3] Heat.
Fusion power is held fixed, so diverting h MW-th costs η_gen × h of saleable electricity; the reactor is never resized. Offtake grows 200 / 300 / 400 / 500 MW-th and price $20 / $40 / $50 / $80 per MWh-th across the rungs, with 4 h TES at $30/kWh and heat-side BoP at $200/kW-th from tier 2. Capacity payments are credited on the incremental firm MW only — $40/kW-yr at tier 2 and $140/kW-yr at tier 3 — because crediting the full plant would double-count capacity the electricity-only case already earns. Diversion reaches 20% of output at tier 3; past roughly half, effective LCOE stops being a meaningful metric because the electricity denominator collapses.
[4] Gold production and mercury loading.
Production is read off Marathon’s own neutronics scan rather than assumed. Their Figure 5 is fitted by Au(t) = A(1 − e^(−t/λ)) with λ = 74.2 mm and A = 3.13 t/yr at 1500 MWth, reproducing the whole 5–350 mm scan to an rms of 39 kg/yr and hitting their stated 210 mm design point (2,953 kg/yr, TBR 1.19) exactly. Gold production therefore saturates: doubling the mercury buys about +51%, and their 415 t/GW-th reference blanket costs 4.15× the mercury for 1.9× the gold. The asymptote is 2,087 kg/GW-th/yr, which is 75% of the hard neutron-budget bound of 2,787 kg/GW-th/yr (one 197Au per >9 MeV neutron, one such neutron per D‑T fusion).
[5] Gold cooldown.
Marathon give three thresholds: 6.8 yr to reach NRC Class-A low-level waste, 13.7 yr to require no radioactive labeling at all (Class 7, 2,700 pCi/g for 197Au), and 17.7 yr to fall below banana-equivalent activity. The non-fungibility argument rests on the placard, which clears at 13.7 yr — so the published 14 yr is that threshold, and it is held at every rung.
[6] Mercury feedstock and the enrichment plant.
With no credit for the 198Hg-depleted tails the model charges natural mercury at $30/kg across the whole natural mass, an implied $301 per kg of 90%-enriched product. Reselling the tails into the existing mercury market is ordinary commercial practice and puts it at $61/kg-enriched; disposing of them instead would be $775. Enrichment capital is excluded at every rung, and the source supports that rather than deferring it. Marathon sizes the photochemical separation directly: 270 kW of wall-plug power processes 100 t of 198Hg per year, which is what yields the $2.4/kg OPEX at $0.10/kWh. Their basis is ten photons per excitation, 33% wall-plug efficiency for a mercury vapor lamp, and 85% of the emission landing on the 254 nm line. Priced against commercial lamp and microwave-source hardware at $0.06–0.065/W — or a deliberately conservative $1/W — they put the separation plant under $1M. The margin against that number is very wide: canceling gold’s tier-0 benefit of $157 M/yr would take $1.95 B of enrichment capital, which against the 859 kW the tier-0 inventory needs works out to about $2,300/W. The same test on the feedstock puts breakeven at $643/kg of natural mercury, or $6,446/kg of enriched product — eight times the $775 disposal-priced case above, and 21 times the $30/kg the model charges.
Scaling that to the blanket loadings used here, 318 t of 198Hg at tier 0 needs 858 kW to load out in a year and 1,320 t at tier 3 needs 3.6 MW, so the capital lands between roughly $0.4M and $3.6M depending on which driver price is taken. Annualized, that is under $0.05/MWh at every rung — small enough that excluding it changes nothing, and small enough that the load-out schedule does not matter either. Enriching the initial inventory once is the same order, $0.8M at tier 0 and $3.2M at tier 3; the model charges only the annual makeup, the 0.5–1%/yr actually transmuted, which sits inside the source’s stated 0.3–1.2%.
[7] Synthetic fuel.
A port of the H₂-led tool, validated against it to four decimal places. The electrolyzer is sized to the MWe heat gives up at the same rung — 80 / 120 / 160 / 200 MW — so the two diverting streams carry matched kit and diversion falls out as a result rather than being imposed. Hydrogen prices take heat’s own optimism profile (×2.00, ×1.25, ×1.60): grey $1.50, then $3.00 at the US 45V maximum statutory rate, then $3.75, then $6.00 — mid-range of today’s unsubsidized green production cost of $4.50–7.00/kg. Stack capital follows IRENA (2020): $700/kW inside their 2020 installed range of $650–1,000, then $307/kW and $130/kW at the 1 TW and 5 TW ends of their 2050 projection. Low-temperature electrolysis at 52 kWh/kg throughout; grid volatility is held fixed because effective LCOE has no price term for the electricity sold, so the real benefit of volatility — diverting the cheapest hours, worth about $10 M/yr at tier 2 — appears in NPV and captured price instead.
[8] Known asymmetries.
Two are deliberate and worth stating. Gold’s tier 0 grants a 3% discount rate on the fourteen-year deferral where heat’s and synfuel’s tier 0 carry only ordinary market conditions. The enrichment plant is excluded at every rung, but that is not an asymmetry in gold’s favor — the source sizes it below $1M.[6] And gold has no price lever — $100k/kg is spot — so its only escalating input is volume, which lands entirely at tier 3, while heat and synfuel ramp both price and volume at every rung. The total tier 3 ask is comparable; the shape is not. Separately, the heat price row is the least sourced part of this analysis: the $20, $40 and $50/MWh-th values and the $40/kW-yr capacity payment are estimates rather than citations.
[9] Sources.
Parisi, J. & Schiller, J. (2026). The Value and Cost of Fusion Neutrons. Marathon Fusion.
Rutkowski, A., Harter, M. & Parisi, J. (2025). Scalable Chrysopoeia — gold via (n,2n) transmutation. Marathon Fusion.
Ward, S. et al. (2025). Fusion for high-value heat. arXiv:2504.11072.
Handley, M. C., Slesinski, D. & Hsu, S. C. (2021). Potential Early Markets for Fusion Energy. Journal of Fusion Energy.
IRENA (2020). Green Hydrogen Cost Reduction: Scaling up Electrolysers to Meet the 1.5 °C Climate Goal.
UN Environment Programme, Global Mercury Supply, Trade and Demand (2017); USGS mercury price series.
Originally published at 1cf.energy.